How to Invest Like Warren Buffett: The Part You Can Actually Copy
How to invest like Warren Buffett: copy the patience, not the portfolio. His edge was insurance float, now $177.5 billion, and terms you can't get.
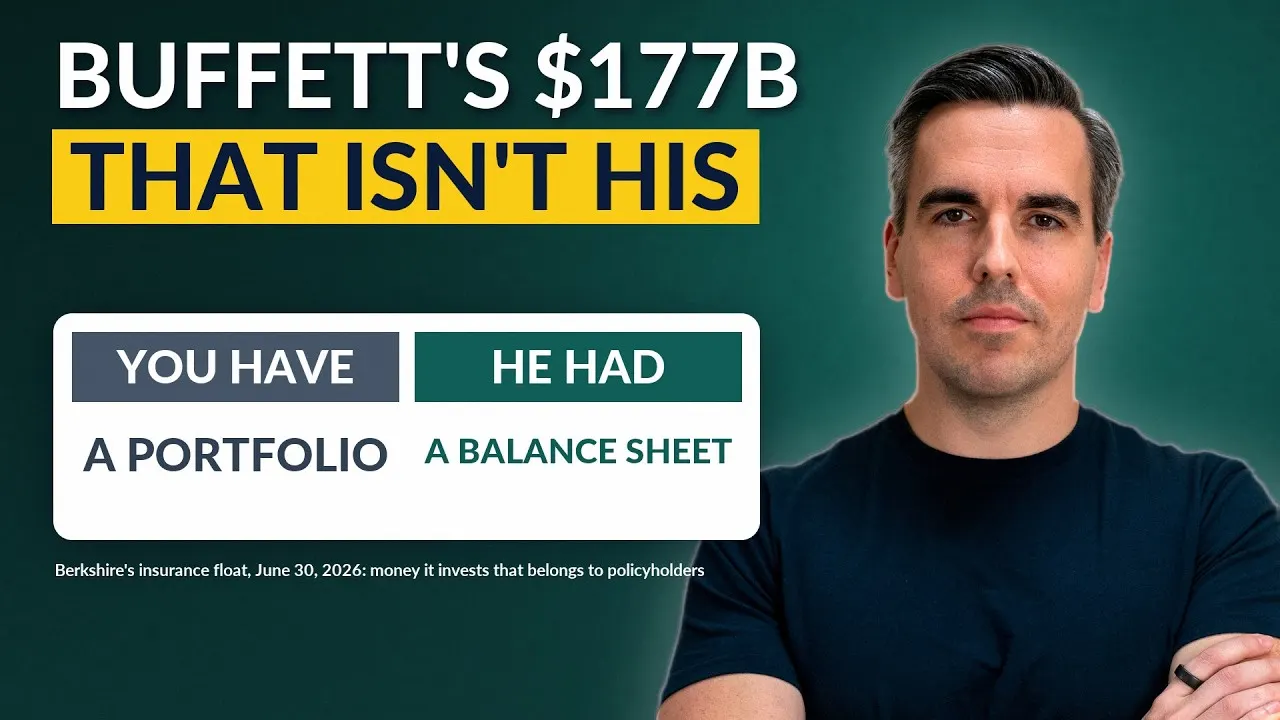
Warren Buffett's Investment Strategy: The Part You Can't Copy
Prefer to watch? This article is the written companion to the video above.
Should you invest like Warren Buffett? If you mean buying what he buys, the evidence says no. If you mean holding what you own through a 50% fall without selling, yes, and that part is free.
Here is the number that decides it. On June 30, 2026, Berkshire Hathaway held about $177.5 billion of insurance float: money that belongs, in the end, to policyholders, sits on Berkshire’s balance sheet until their claims are paid, and cannot be called back on short notice. In most years it has cost Berkshire less than nothing. Nobody who copies Buffett’s stock list gets any of it.
You have a portfolio. He had a balance sheet.
The rest of this page is the evidence for that sentence. It is not about which stocks to pick; if that is your question, the value-investing article is the better place. This one is about what the stocks were bought with. If you only want the practical part, the three habits you can copy are further down.
Can you copy Warren Buffett’s portfolio?
Partly, and late. Every manager with more than $100 million in US stocks files a Form 13F with the SEC each quarter, Berkshire included, and within hours Berkshire’s list is on half the finance sites on the internet. It looks like a recipe. Look at what the form actually contains before you cook from it.
The list is late. The deadline is 45 days after the quarter ends, so a position bought on January 2 can stay invisible until the middle of May. A manager can also ask the SEC for confidential treatment, which delays a position’s disclosure by up to a year, and Berkshire has used it. Its stake in Chubb, 20.1 million shares worth $4.54 billion at the end of 2023, appeared only in an amended filing in May 2024.
The list is partial. A 13F shows long positions in US-listed stocks on one day, the last day of the quarter: no bonds, no cash, nothing bought and sold in between.
And it leaves out most of Berkshire. The railroad, the energy company, the insurers, the manufacturers and retailers that Berkshire owns outright never appear on a 13F, and they are where most of its operating profit is made. What you can download is an incomplete list, at least six weeks old, of the part of Berkshire that is easiest to see.
What is insurance float?
Berkshire is, before anything else, an insurance company. Premiums arrive today; claims are paid over years. In between, the money sits with the insurer, and the insurer may invest it. Berkshire’s 10-K defines float as “the approximate net policyholder funds generated through underwriting activities that are held for investment.”
At the end of 2025 it was about $176 billion. On June 30, 2026 it was about $177.5 billion, according to Berkshire’s release of August 8, 2026. In 1970 it was $39 million.
Berkshire Hathaway · insurance float at year-end, USD
The float grew from $39 million in 1970 to about $176 billion in 2025
Logarithmic scale: each step up is ten times the one below. Amber: the end of 2025.
What does that money cost? Buffett answered in his 2017 letter, and the condition is part of the sentence: “That disciplined behavior has produced underwriting profits in most years, and in such instances, our cost of float was less than zero.” In most years, then, not in every year. In those years premiums exceeded losses and expenses, and Berkshire was in effect paid to hold other people’s money.
No brokerage account comes with that.
How much of Buffett’s return came from leverage?
This is the question the 13F cannot answer, and the one researchers have answered in the most detail. In 2018 three researchers, Andrea Frazzini, David Kabiller and Lasse Heje Pedersen, published “Buffett’s Alpha” in the Financial Analysts Journal. They took Berkshire’s record from October 1976 to March 2017 apart the way a bank’s risk department would take apart any portfolio: not by asking what was bought, but by asking how it was financed and what kind of risk it carried.
Start with the record itself, because it deserves the respect. Over that period Berkshire stock earned an excess return of 18.6% a year over Treasury bills with a volatility of 23.5%, a Sharpe ratio of 0.79 against 0.49 for the US market. (The Sharpe ratio is the return above Treasury bills for each unit of volatility; higher means more return for the same ride.) Among all US stocks with at least a 40-year history from 1976 to 2017, that was the highest. The forty-year condition is the paper’s and belongs with the claim, but forty years at the top is not luck in any ordinary sense.
Now the financing. The researchers estimate Berkshire’s average leverage at about 1.7 to 1. Put plainly: for every dollar of Berkshire’s own capital, roughly another 70 cents came from someone else. About 35% of Berkshire’s liabilities, on average, were insurance float, and that float cost an estimated 1.72% a year, about 3 percentage points below the average rate on US Treasury bills. That comparison with Treasury bills is the researchers’, not Buffett’s. In the eleven letters checked for this episode he never makes it; his own words are always “less than zero”, “costless” or “paid to hold it”. The point stands either way. Berkshire borrowed, on average, more cheaply than the US government.
Then the second step, the one that decides this episode. The researchers controlled for six factors, the standard ways in which whole groups of stocks earn more or less than the market: the market itself, company size, value (stocks that are cheap against their book value), momentum (recent winners), and two that describe the kind of company Buffett liked. Betting-against-beta captures stocks that move less than the market. Quality-minus-junk captures companies that are profitable, stable and well run. Berkshire loaded heavily on both. In plain words, Buffett bought steady, high-quality, low-drama companies and held them with cheap borrowed money.
What is left after such controls is called alpha: the return that the factors do not explain, the part one would credit to skill. “Statistically insignificant” means it cannot be told apart from zero with any confidence. What was left, in their words: “Controlling for these factors drives the alpha of Berkshire’s public stock portfolio down to a statistically insignificant annualized 0.3%.”
Buffett's Alpha · return left after six risk factors, % a year, 1976–2017
After the controls, the part a 13F shows is left with 0.3% a year, not distinguishable from zero
Controls: market, size, value, momentum, low-beta and quality. Amber: the public stock portfolio, the part you can copy.
Read the population carefully, because this is where the sentence is most often misquoted. The 0.3% is the public stock portfolio, the holdings that appear on a 13F, which is exactly the part you can copy. For Berkshire’s own shares the remaining alpha is larger, about 5.4% a year, though it is not statistically significant either. Nobody is saying Buffett’s edge was zero. The finding is narrower and, for anyone trying to copy him, more uncomfortable: once the type of company is accounted for, the part you can see adds nothing that can be told apart from zero. In the researchers’ account, the record came largely from the style itself, safe and high-quality companies, and from the cheap money that scaled it up. A copier gets the list without the money.
What follows is my interpretation, not a finding of the paper. Buffett built his record in a market that was anything but efficient. Information was expensive, and quality was cheap, because almost nobody measured it. Today quality is a product. You can buy a quality or low-volatility index fund for a fraction of a percent a year, in part because Buffett spent decades proving that these companies were underpriced. His edge was not stolen. It was packaged and sold back to everyone else.
What terms did Buffett get in 2008?
The second thing you cannot copy is the phone call. In the 2010 letter Buffett described what permanent capital allowed Berkshire to do in a crisis: “That’s what allowed us to invest $15.6 billion in 25 days of panic following the Lehman bankruptcy in 2008.” In those weeks, investors who could ask for their money back were asking for it. Berkshire had no withdrawals to meet. Its insurance contracts, in Buffett’s 2019 words, are such that “we can never be subject to immediate or near-term demands for sums that are of significance to our cash resources.” Nobody can pull their money out of Berkshire the way investors pull money out of a fund.
He could commit billions when few others could, and the terms of those years reflected it:
| Deal | Date | Amount | Annual coupon | Extra |
|---|---|---|---|---|
| Goldman Sachs | September 2008 | $5.0 billion preferred | 10% | warrants on 43,478,260 shares at $115, five years |
| General Electric | October 2008 | $3.0 billion preferred | 10% | warrants on $3.0 billion of shares at $22.25, five years |
| Dow Chemical | July 2008, agreed October 2008 | $3.0 billion convertible preferred | 8.5% | convertible into common shares |
| Wrigley (Mars) | April 2008, funded October 2008 | $4.4 billion notes and $2.1 billion preferred | 11.45% on the notes, 5% on the preferred | |
| Swiss Re | March 2009 | CHF 3.0 billion convertible | 12% | |
| Bank of America | August 2011 | $5.0 billion preferred | 6% | warrants on 700,000,000 shares at $7.142857, ten years |
| Occidental | May 2019 | $10.0 billion preferred | 8% | warrants on 80,000,000 shares at $62.50 |
From the companies’ 8-K filings and Berkshire’s 10-Qs for 2008 and the first quarter of 2009. Dow and Wrigley were committed before the Lehman bankruptcy and funded after it.
Bank of America is the cleanest example of how such a deal ends, because the outcome is in Berkshire’s own numbers. In August 2011 Berkshire put in $5.0 billion for preferred stock paying 6% a year, plus the right to buy 700 million common shares at about $7.14 each for ten years. At the end of 2017 Berkshire held those 700 million shares at a cost of $5,007 million. Their market value was $20,664 million.
None of these offers was on a brokerage platform. They went to the one buyer who could commit billions within days and was certain not to be forced to sell.
Do funds that copy 13F filings work?
Now the fair objection, and probably the one you are holding. Fine, no float and no call from Goldman Sachs. But the list is public. Why not buy what he buys a month after he discloses it?
Someone measured exactly that. A study by Martin and Puthenpurackal of Berkshire’s disclosed holdings found that Berkshire’s stock portfolio beat the S&P 500 by an average of 11.14% a year from 1976 to 2006, in 27 of 31 years, and that a portfolio buying the positions only in the month after they were disclosed still beat it by 10.75% a year. That is a serious result, and I am not going to argue it away. I will add the limits that belong in the same paragraph. It is a working paper, last revised in 2008 and never peer-reviewed. Its data end in 2006, before the twenty years in which Berkshire’s public portfolio came to be dominated by a single position. It does not deduct a private investor’s trading costs or taxes. And it sits uneasily with the factor result above: measured against the S&P 500 alone, the disclosed portfolio won; measured after the factor controls, 0.3% is left.
What makes this argument unusual is that it did not stay on paper. People built funds on the idea, with real money and real fees, and their results are public.
In June 2012 Global X launched the Guru Index ETF. Its prospectus describes the method: the index provider “utilizes Form 13F filings to compile the top stock holding from each of these hedge funds”, weights them equally and rebalances quarterly on the 13F calendar. Precisely the idea. The fund still trades. Over the ten years to the end of 2025 it returned 11.03% a year, against 14.82% for the S&P 500. In money: $10,000 became about $28,471 in the fund and about $39,827 in the index.
Five days earlier, AlphaClone had launched a cleverer version that scored managers on how their disclosed picks had performed and followed only the best. From launch to the end of 2021 it returned 12.85% a year against 16.68%; until December 2017 its index also carried a downside hedge, so the record is not a pure copy strategy. It was liquidated in August 2022. In 2014 Direxion launched the iBillionaire Index ETF: the 13F holdings of billionaire investors, 30 stocks, equally weighted. From launch to the end of 2017, 8.46% a year against 12.33%. It closed in April 2018.
13F copy funds vs. S&P 500 · average annual total return, USD
Three funds, three windows, and all three about 3.8 points a year behind the index
Each fund against the S&P 500 over its own window, so each row stands alone. Amber: the gap.
Three sponsors, three different stretches of the market, and three results within a tenth of a point of each other: 3.79, 3.83 and 3.87 points a year behind the index. They were not the only attempts. Global X also ran small-cap, international and activist versions, and AlphaClone an international one; all four closed, which makes six closures in this small corner of the fund market.
One limit, stated plainly: none of these funds copied Berkshire alone. They copied baskets of hedge funds and billionaire investors. A fund built on Berkshire’s own holdings was launched in March 2025; it is too young to judge, and I will not pretend its record says anything yet. What the evidence does say is that each of the three versions with a published long record lost to the index.
Fees explain part of that. The Guru fund charges 0.75% a year; the gap was nearly 3.8 points. The fee calculator shows what 0.75% removes over a decade, and it is not 3.8 points a year. My reading of the rest, which no fund document states: a stale list, prices that had already moved by the time the list was public, and no balance sheet underneath.
Has Berkshire beaten the S&P 500 recently?
This is the question people skip because it sounds disrespectful. It isn’t. It decides how much the rest of this page matters to you, because if the machine still ran at full speed, everything above would be detail.
| Period | Berkshire, market value per share | S&P 500, with dividends |
|---|---|---|
| 1965 to 2025 | 19.7% a year | 10.5% a year |
| 2006 to 2025 (20 years) | 11.3% a year | 11.0% a year |
| 2016 to 2025 (10 years) | 14.3% a year | 14.8% a year |
| 2025 | 10.9% | 17.9% |
Compounded annual rates to December 31, 2025. 1965 to 2025 as printed in Berkshire’s 2025 annual report; the 10- and 20-year rows and 2025 are my own calculation from Berkshire’s published annual return series in the same report. Berkshire pays no dividend, so the change in market value is its total return.
Over the last ten years Berkshire trailed the index. Over twenty, the two are level. That is not a scandal, and it is not a decline in the man. It is arithmetic, and Buffett announced it himself in 1994, when Berkshire’s net worth was $11.9 billion: “the future performance of Berkshire won’t come close to matching the performance of the past.” In the same letter: “A fat wallet, however, is the enemy of superior investment results.” In 2023 he described what was left to buy: “There remain only a handful of companies in this country capable of truly moving the needle at Berkshire, and they have been endlessly picked over by us and by others.”
Endlessly picked over, in his words.
The 19.7% is not a formula still quietly running in Omaha. It is the record of a machine built for a market that no longer exists in that form, and its builder said so more than thirty years before the last line of the table.
What can a private investor actually copy from Buffett?
Something real, and it costs nothing. In his letter of November 10, 2025, written before he stepped down as CEO, Buffett wrote: “Our stock price will move capriciously, occasionally falling 50% or so as has happened three times in 60 years under present management.” Three halvings. His advice to shareholders in the same passage: “Don’t despair; America will come back and so will Berkshire shares.”
Staying invested through a fall like that costs nothing, and it is the part private investors measurably fail at. Brad Barber and Terrance Odean studied 66,465 US households from 1991 to 1996 and found that “those that trade most earn an annual return of 11.4 percent, while the market returns 17.9 percent.” What separated the two groups was how often they traded.
Three habits come out of this episode, and none of them needs a balance sheet:
- Read the date on a 13F before the list. You are not buying his decision. You are buying its aftermath, at least six weeks later.
- Before you sell in a falling market, ask one question: has the business changed, or only the price? If only the price has changed, you are where Berkshire’s own shareholders stood three times. When selling does make sense, these are the exit rules, and Berkshire has them too.
- Run on yourself the test those funds published. Take your own return over the last three years and set it next to a plain broad index fund over the same period, both with dividends. Every fund in this article had to publish that comparison. Most private investors never make it.
What did Buffett put in his own will?
He wrote it down, in the 2013 letter, under the heading “Some Thoughts About Investing”: “My money, I should add, is where my mouth is: What I advise here is essentially identical to certain instructions I’ve laid out in my will. One bequest provides that cash will be delivered to a trustee for my wife’s benefit.” Then the instruction: “Put 10% of the cash in short-term government bonds and 90% in a very low-cost S&P 500 index fund. (I suggest Vanguard’s.)”
Keep the scope exact. This governs one cash bequest to a trust for his wife. It is not an instruction for his whole estate, and it is not advice that everyone should hold 90/10. He wrote S&P 500 because he is American; an investor elsewhere would read it as a broad, cheap index fund. The point is not the index. When the most admired investor of the last sixty years wrote down what should happen to his own family’s cash, he did not write “Berkshire”.
Which raises the next question, and the next episode: should you simply buy the S&P 500? How concentrated that fund really is, and what the usual fixes change, is in index fund risk. The case for and against active funds, from the scorecards, is in the article on index funds against active funds.
One fact has changed since that letter. Since January 1, 2026, Greg Abel has been Berkshire’s chief executive. Buffett stayed on as chairman, and the letter for 2025 is signed by Abel. That matters less than it sounds. What people were trying to copy was never the job title. It was the balance sheet.
The short answer
You can copy the list. You cannot copy the float, the terms of 2008, or sixty years of never being forced to hand the money back. The patience is the other half of the record, and that half is yours for free.
Keep going
Finished reading? Three places to go next
- Try it with your numbersWhat your fund fees actually cost Set a fund’s fee against a low-cost index fund and see what it removes from the final balance.
- Read nextIndex Funds vs Active Funds: 98% Lost to Their Index Buffett wrote “index fund” into his will. This is the case for and against it, from the scorecards.
- On YouTubeSubscribe on YouTube (opens YouTube in a new tab)New videos every Tuesday: one money question per episode, checked against the data.
Primary sources (30)
- 012025 Annual Report, shareholder letter and table 'Berkshire's Performance vs. the S&P 500': compounded annual gain 1965–2025 of 19.7% against 10.5% for the S&P 500 with dividends, overall gain 6,099,294% against 46,061%; annual rows used for the 10- and 20-year calculation in this article; letter signed by Greg Abel, February 28, 2026 — Berkshire Hathaway, 2026
- 02Form 10-K for 2025: float defined as 'the approximate net policyholder funds generated through underwriting activities that are held for investment'; float of approximately $176 billion at the end of 2025 — Berkshire Hathaway, filed March 2, 2026
- 03News release on second-quarter 2026 results: insurance float of approximately $177.5 billion at June 30, 2026 — Berkshire Hathaway, August 8, 2026
- 04Shareholder letters, year-end float figures 1970 to 2024 as used in the float chart — Berkshire Hathaway
- 05Buffett's Alpha, Financial Analysts Journal 74(4), 35–55; sample October 1976 to March 2017: Sharpe ratio 0.79 against 0.49 for the market, average leverage about 1.7 to 1, float cost 1.72% a year about 3 percentage points below the average T-bill rate, alpha of the public stock portfolio a statistically insignificant 0.3% a year after factor controls — Andrea Frazzini, David Kabiller and Lasse Heje Pedersen, 2018
- 06Shareholder letter 2017: 'That disciplined behavior has produced underwriting profits in most years, and in such instances, our cost of float was less than zero'; holdings table at December 31, 2017, Bank of America 700,000,000 shares, cost $5,007 million, market value $20,664 million — Warren E. Buffett, Berkshire Hathaway, 2018
- 07Frequently asked questions about Form 13F: filing due within 45 days after the end of the calendar quarter; confidential treatment can delay disclosure — U.S. Securities and Exchange Commission, Division of Investment Management
- 08Form 13F-HR/A for December 31, 2023, filed May 15, 2024, disclosing a position previously under confidential treatment: Chubb, 20,100,000 shares, $4,542.6 million — Berkshire Hathaway, 2024
- 09Shareholder letter 2010: '$15.6 billion in 25 days of panic following the Lehman bankruptcy in 2008' — Warren E. Buffett, Berkshire Hathaway, 2011
- 10Shareholder letter 2019: insurance contracts such that Berkshire 'can never be subject to immediate or near-term demands for sums that are of significance to our cash resources' — Warren E. Buffett, Berkshire Hathaway, 2020
- 11Form 8-K, Goldman Sachs: $5 billion of 10% perpetual preferred stock and warrants on 43,478,260 shares at $115, five years — The Goldman Sachs Group, September 29, 2008
- 12Form 8-K, General Electric: $3.0 billion of 10% perpetual preferred stock and warrants on 134,831,460 shares at $22.25, five years — General Electric, October 2008
- 13Form 8-K, Dow Chemical: $3.0 billion of convertible preferred stock to Berkshire Hathaway at 8.5% — The Dow Chemical Company, October 27, 2008
- 14Form 10-Q for the first quarter of 2009: Wrigley $4.4 billion of 11.45% notes and $2.1 billion of 5% preferred stock; Swiss Re CHF 3.0 billion of 12% convertible perpetual capital instrument — Berkshire Hathaway, 2009
- 15Form 8-K, Bank of America: $5 billion of 6% preferred stock and warrants on 700,000,000 shares at $7.142857, ten years — Bank of America, August 25, 2011
- 16Form 8-K, Occidental Petroleum: $10 billion of 8% preferred stock and warrants on 80,000,000 shares at $62.50 — Occidental Petroleum, May 2019
- 17Imitation is the Sincerest Form of Flattery: Warren Buffett and Berkshire Hathaway, working paper (not peer-reviewed), last revised May 5, 2008; 1976–2006: Berkshire's portfolio beat the S&P 500 by 11.14% a year on average and in 27 of 31 years; a portfolio buying in the month after disclosure earned 10.75% a year over the index — Gerald S. Martin and John Puthenpurackal, SSRN 806246
- 18Global X Guru Index ETF, summary prospectus (497K): index built from Form 13F filings, management fee 0.75%, 10 years to December 31, 2025: 11.03% a year against 14.82% for the S&P 500 — Global X Funds, filed February 27, 2026
- 19Global X Funds, post-effective amendment (485BPOS): Global X Guru Index ETF commencement of operations June 4, 2012 — Global X Funds, filed February 26, 2026
- 20AlphaClone Alternative Alpha ETF, summary prospectus (497K): inception May 30, 2012 to December 31, 2021, 12.85% a year against 16.68% for the S&P 500 — AlphaClone Alternative Alpha ETF, filed July 29, 2022
- 21AlphaClone Alternative Alpha ETF, supplement on the liquidation of the fund on August 31, 2022 — AlphaClone Alternative Alpha ETF, filed August 11, 2022
- 22Direxion iBillionaire Index ETF, summary prospectus (497K): inception August 1, 2014 to December 31, 2017, 8.46% a year against 12.33% for the S&P 500 — Direxion Shares ETF Trust, filed February 28, 2018
- 23Direxion iBillionaire Index ETF, supplement on closing (April 6, 2018) and liquidation (April 13, 2018) — Direxion Shares ETF Trust, filed March 2, 2018
- 24Shareholder letter 1994: 'the future performance of Berkshire won't come close to matching the performance of the past'; 'A fat wallet, however, is the enemy of superior investment results' — Warren E. Buffett, Berkshire Hathaway, 1995
- 25Shareholder letter 2023: 'There remain only a handful of companies in this country capable of truly moving the needle at Berkshire, and they have been endlessly picked over by us and by others' — Warren E. Buffett, Berkshire Hathaway, 2024
- 26Letter of November 10, 2025: 'Our stock price will move capriciously, occasionally falling 50% or so as has happened three times in 60 years under present management' — Warren E. Buffett, Berkshire Hathaway, November 10, 2025
- 27Trading Is Hazardous to Your Wealth, Journal of Finance 55(2), 773–806; 66,465 households, 1991–1996: the most active traders earned 11.4% a year against 17.9% for the market — Brad M. Barber and Terrance Odean, 2000
- 28Shareholder letter 2013, section 'Some Thoughts About Investing': the cash bequest to a trustee for his wife's benefit, 'Put 10% of the cash in short-term government bonds and 90% in a very low-cost S&P 500 index fund. (I suggest Vanguard's.)' — Warren E. Buffett, Berkshire Hathaway, 2014
- 29Form 8-K on the succession: Greg Abel to become President and CEO on January 1, 2026; Buffett to remain Chairman of the Board — Berkshire Hathaway, filed May 8, 2025
- 30Form 8-K/A: Greg Abel President and Chief Executive Officer effective January 1, 2026 — Berkshire Hathaway, filed January 6, 2026
Questions people actually ask
Can you copy Warren Buffett's portfolio?
Only the visible part, and only late. Berkshire Hathaway reports its US stock holdings on Form 13F, which is due 45 days after each quarter ends; a manager can ask the SEC for confidential treatment, which can delay a position's disclosure by up to a year. Berkshire has done so: its stake in Chubb, 20.1 million shares worth $4.54 billion at the end of 2023, was disclosed in an amended filing in May 2024. A 13F shows long positions in US-listed stocks on the last day of the quarter. It does not show bonds, cash, trades during the quarter, or the businesses Berkshire owns outright, such as its railroad, energy company and insurers.
What is insurance float?
Float is money an insurer holds between collecting premiums and paying claims. Berkshire Hathaway's 10-K for 2025 defines it as the approximate net policyholder funds generated through underwriting activities that are held for investment, and puts it at about $176 billion at the end of 2025; Berkshire's release of August 8, 2026 gives about $177.5 billion on June 30, 2026. In 1970 it was $39 million. In his 2017 letter Buffett wrote that disciplined underwriting had produced underwriting profits in most years, and that in those years the cost of float was less than zero.
How much of Buffett's return came from leverage?
Leverage scaled up the return of the stocks Berkshire held. Frazzini, Kabiller and Pedersen, 'Buffett's Alpha', Financial Analysts Journal, 2018 (data from October 1976 to March 2017), estimate Berkshire's average leverage at about 1.7 to 1, financed in part by insurance float (on average about 35% of its liabilities) at an average cost of 1.72% a year, about 3 percentage points below the average US Treasury bill rate. The stock picks themselves look ordinary once the type of company is accounted for: after controlling for market, size, value, momentum, betting-against-beta (low-risk stocks) and quality factors, the alpha of Berkshire's public stock portfolio falls to 0.3% a year, which is not statistically significant. For Berkshire's own shares the remaining alpha is larger, about 5.4% a year, but also not statistically significant.
Do funds that copy 13F filings work?
The three best-documented ones did not beat the market. The Global X Guru Index ETF returned 11.03% a year over the 10 years to December 31, 2025 against 14.82% for the S&P 500. The AlphaClone Alternative Alpha ETF returned 12.85% a year from launch to the end of 2021 against 16.68%, and was liquidated in August 2022. The Direxion iBillionaire Index ETF returned 8.46% a year from launch to the end of 2017 against 12.33%, and closed in April 2018. A 2008 working paper by Martin and Puthenpurackal found the opposite for Berkshire's own disclosed holdings from 1976 to 2006; it was never peer-reviewed and ends in 2006.
Has Berkshire Hathaway beaten the S&P 500 recently?
Not over the last ten years. Calculated from Berkshire's own published annual return series, Berkshire's market value per share rose 14.3% a year from 2016 to 2025, against 14.8% for the S&P 500 with dividends; over 2006 to 2025 it was 11.3% against 11.0%; in 2025 alone, 10.9% against 17.9%. Over 1965 to 2025 Berkshire reports 19.7% a year against 10.5%. All figures are compounded annual rates to December 31, 2025.
What did Warren Buffett put in his will?
In his 2013 shareholder letter Buffett described one bequest in his will: cash delivered to a trustee for his wife's benefit, with the advice to 'Put 10% of the cash in short-term government bonds and 90% in a very low-cost S&P 500 index fund. (I suggest Vanguard's.)' It covers that cash bequest, not his whole estate, and it is not a general recommendation to hold 90/10. The notable point is what he did not write: Berkshire.
Is Warren Buffett still CEO of Berkshire Hathaway?
No. Greg Abel has been President and CEO of Berkshire Hathaway since January 1, 2026 (Form 8-K/A filed January 6, 2026). When the change was announced in May 2025, Berkshire said Buffett would remain Chairman of the Board. The shareholder letter for 2025, dated February 28, 2026, is signed by Abel.