Dividend Investing: Can You Live Off Dividends?
At the S&P 500's dividend yield, $100,000 pays about $1,100 a year. What living off dividends takes, what a dividend costs you, and how to start.
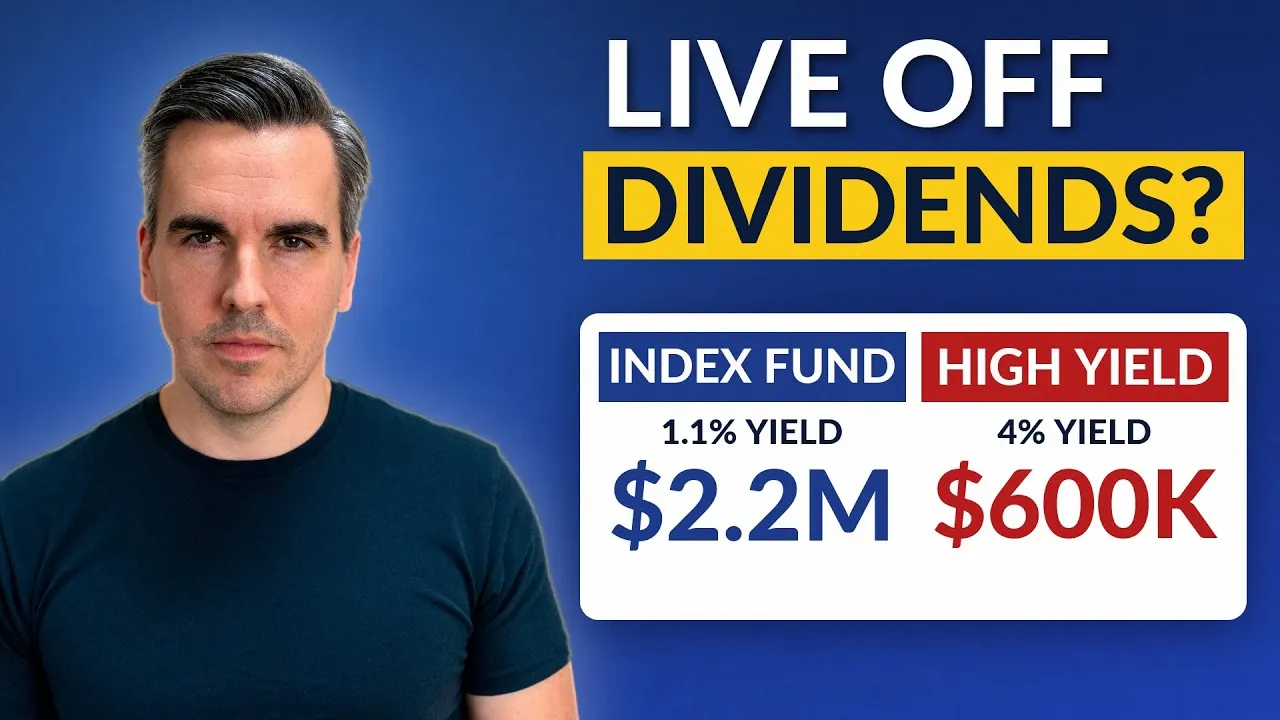
Live Off Dividends: How Much You Need Invested for $2,000 a Month
Prefer to watch? This article is the written companion to the video above.
$100,000 in a broad S&P 500 index fund pays about $1,100 a year in dividends, before tax. That is the index’s own dividend yield, 1.12% on June 30, 2026, applied to a round number (a fund pays a little less after its costs), and for most people it ends the question of living off dividends before it starts.
The number is small, but not because the companies in the index are stingy. It is small because the dividend is only one of two ways they pay their owners, and the smaller one. The dividend isn’t the payment. It’s the part of the payment you can see.
Can you live off dividends?
Yes, if the portfolio is large enough. The useful part of the answer is how large.
Take a round target: $2,000 a month, which is $24,000 a year before tax. Divide it by the yield and you get the portfolio that produces it.
| Where the yield comes from | Yield | Portfolio for $24,000 a year |
|---|---|---|
| The S&P 500 index | 1.12% (June 30, 2026) | about $2.14 million |
| A large US high-dividend fund | 4.07% (August 13, 2026) | about $590,000 |
In the video I round the two yields to 1.1% and 4%, which gives about $2.2 million and roughly $600,000. The yields have moved since, and the picture hasn’t: at 1.10% on September 30, 2026, the index needs about $2.18 million; at the fund’s 4.35% on October 22, about $552,000. Three weeks earlier, on September 30, the same fund had shown 4.71%.
What $2,000 a month costs in capital · yields as of June and August 2026
$2,000 a month takes about $2.1 million at the index's yield, or $590,000 at a high-dividend fund's
Capital needed for $24,000 a year, before tax, at two different dividend yields. Amber: the plan that builds a share of the whole index.
The same $2,000 a month needs about $2.14 million at the S&P 500's dividend yield and about $590,000 at a high-dividend fund's yield. These are two different plans, not two versions of one: the first builds a share of the whole index, the second buys a 4% yield, which means a narrower slice of the market.
Those aren’t two versions of one plan. They are two different plans, and most people never notice which one they picked. The first builds a portfolio and takes whatever dividend the whole market pays. The second starts from the income and buys whatever pays 4%. It needs only about a quarter of the money, and that is where the risk lives: a 4% yield comes from a narrower slice of the market, chosen for its yield, and that slice has a record of its own.
Two cautions on the arithmetic. The yields are snapshots; a fund’s own yield is calculated differently from the index figure, and both move every day. And the income is before tax, which can take a noticeable part of it depending on where you live. This is a calculation with current numbers, not a promise of what either portfolio will pay.
Is a dividend real money, or your own money handed back?
Ask about dividends and you hear two answers that never quite meet. One says it’s real money: it lands in your account every quarter, you sold nothing to get it, and nobody can take it back. The other says it’s your own money handed back: the company had the cash, now you have it, and the share price dropped to match.
Both are true, which is why the argument never ends. I understand the first camp, too. Money that arrives without you doing anything feels different from a number on a screen going up. But both camps are arguing about whether the dividend is real, and that question decides nothing. What decides something is what the dividend costs you and what it buys you.
The cost shows up on one particular day. The SEC’s investor site, in its note on special dividends, puts it carefully: “With a significant dividend, the price of a stock may fall by that amount on the ex-dividend date.” The CFA Institute’s curriculum says that, all else held constant, the price “can be expected to drop by the amount of the dividend”. May fall, can be expected to. Plenty of pages online drop that care and say the price falls by exactly the dividend. The measurements say otherwise.
Ex-dividend day · three studies, 1960s to 2002
On the ex-dividend day, prices fall by about the dividend, not by exactly the dividend
The share of the dividend by which the price fell on the ex-dividend day, by market and period. 100% would mean the price falls by exactly the dividend. Amber: the measured fall.
Most studies find a fall smaller than the dividend, from about half in Hong Kong to over nine tenths in Finland. The size of the gap differs by market and period, and researchers still disagree on why; taxes and trading frictions are the main candidates. There is no winner among the explanations.
Most studies find a fall smaller than the dividend, and how much smaller depends on the market and the period. Researchers have argued about the reason for half a century. Edwin Elton and Martin Gruber read the gap as a tax effect: if dividends are taxed more heavily than price gains, investors value a dollar of dividend at less than a dollar. Murray Frank and Ravi Jagannathan then found a gap in Hong Kong, where neither dividends nor capital gains were taxed, and traced it to how trading works around the date. One German study points the other way. Felix Kreidl looked only at dividends that German shareholders receive tax-free, where theory expects the price to fall by the full amount, and his estimate could not be told apart from the full dividend. I won’t pick a winner, because the research hasn’t.
For your decision it is a footnote. What isn’t a footnote is the direction: a dividend doesn’t add to your wealth. It converts a slice of what you already own into cash.
Finance has a formal version of this. Merton Miller and Franco Modigliani showed in 1961 that, under their assumptions, a company’s dividend policy doesn’t change what its shares are worth. The assumptions do the work, among them perfect capital markets with no taxes and no trading costs. Under them, an investor who wants cash can make a “homemade dividend” by selling shares and ends up in the same place. Outside them the two routes differ in taxes, in costs, and in one thing the dividend investor gets right, which comes up below. Selling isn’t “mathematically better”, as some put it. It is equivalent on paper and different in practice.
Why is the S&P 500’s dividend yield so low?
Because most of what the companies pay their owners never arrives as a dividend.
A bank doesn’t look at the dividend. It looks at the whole payout, and a company has two ways to hand money back. A dividend, where cash leaves the company and lands in your account. And a buyback, where the company buys its own shares in the market; when the share count actually falls, every remaining share owns a larger slice of the company. Both are the company paying its owners. Only one of the two doors opens where you can see it.
If you own a broad index fund, here is the good news, and it really is good: you have been getting the second kind all along. You just never saw the transfer.
And the invisible door is the bigger one. In the 12 months to September 30, 2025, S&P 500 companies paid their owners $1.685 trillion, a record according to S&P Dow Jones Indices. Dividends were $664.9 billion of it, 39.5%. Buybacks were $1.020 trillion.
S&P 500 payout to owners · 2016 to September 30, 2025
Dividends are the smaller way companies pay owners: 36% to 48% of the payout, never half
Dividends and buybacks of S&P 500 companies, calendar years 2016 to 2024 and the 12 months to September 30, 2025. Amber: the dividend, the part everyone sees.
Buybacks were larger than dividends in every calendar year from 2016 to 2024, and in the 12 months to September 30, 2025 dividends were 39.5% of a record $1.685 trillion. The dividend is the part of the payout everyone sees. The bigger share of the cash companies hand back to owners leaves through buybacks.
That isn’t a one-off. Buybacks were larger than dividends in every year from 2016 to 2024:
| Year | Buybacks | Dividends | Dividends’ share of the payout |
|---|---|---|---|
| 2016 | $536.4 billion | $397.2 billion | 43% |
| 2017 | $519.4 billion | $419.8 billion | 45% |
| 2018 | $806.4 billion | $456.3 billion | 36% |
| 2019 | $728.7 billion | $485.5 billion | 40% |
| 2020 | $519.7 billion | $480.4 billion | 48% |
| 2021 | $881.7 billion | $511.2 billion | 37% |
| 2022 | $922.7 billion | $564.6 billion | 38% |
| 2023 | $795.2 billion | $588.2 billion | 43% |
| 2024 | $942.5 billion | $629.6 billion | 40% |
S&P 500, calendar years, from the S&P Dow Jones Indices buyback releases; the shares are my calculation. S&P Dow Jones Indices had not published a full-year 2025 buyback release by October 26, 2026.
2020 came closest. Buybacks fell by 29% from 2019, and the dividend was still the smaller door.
So the $1,100 from the opening is not what the S&P 500 paid you. It is what it paid you where you could see it.
Why is the dividend the smaller door? Partly because managers treat the two very differently. Alon Brav, John Graham, Campbell Harvey and Roni Michaely surveyed 384 chief financial officers and treasurers and found that “managers are very reluctant to cut dividends, that dividends are smoothed through time”. Paying out through repurchases, in the same survey, “is viewed by managers as being more flexible than using dividends”, and dividend increases and buybacks are generally paid out of the cash that is left once investment and liquidity needs are met. Nobody in a boardroom decides “dividend or buyback” in the abstract. The question is how much to hand back and through which door, and the dividend is the part a company commits to keeping in a bad year. The rest goes through the door that can close without a headline.
And the low yield doesn’t mean that few companies pay. At the end of 2025, 409 of the companies in the S&P 500, 81.3%, paid a dividend. They just send most of their payout another way.
Do buybacks really pay you?
Here the video is more careful than most writing on the subject, and the text should be too. In the video I say a buyback makes your slice bigger “when the share count actually falls”. That condition is the whole point.
The S&P Dow Jones figures are gross: the money companies spent buying their own shares. They don’t measure what happened to the number of shares. A company can buy back shares with one hand and issue new ones with the other, when it pays employees in stock or when staff exercise options, and the share count stays where it was. The cash still left the company. It went to the investors who sold, while the new shares took the place of the ones bought back, so for an outside owner nothing got bigger.
“The company bought back shares” and “the share count fell” are two different statements, and only the second one makes your slice larger. You can check it yourself without any database. Every annual report gives the number of shares outstanding, and the diluted count behind earnings per share. Put five years of it next to each other. If the count falls, the buybacks reached you. If it stays flat while the company announces billions in buybacks, they mostly offset new shares for employees.
Keep the scale in mind, though. This caution can decide the story for a single company. It doesn’t turn the $1.020 trillion into an illusion; it means the figure is a gross number and has to be read as one.
What are dividend investors right about?
This is where the skeptics overreach, and two things deserve their full weight.
The first is 2020. In the first half of that year, 62 companies in the S&P 500 cut their dividend, and 41 of those suspended it altogether (S&P Dow Jones Indices). The index’s dividend still finished the year at a record: $58.28 per share on an index basis, against $58.24 in 2019. If you owned the index, your income didn’t fall. If you owned five high-yielders, it could have gone to zero.
That’s not an argument for dividends. It’s an argument for owning a lot of them.
The second is behavior, and the evidence here is unusually good. Konstantin Bräuer, Andreas Hackethal and Tobin Hanspal studied a bank’s customers, linking their actual spending and income to their portfolios and to a survey, and found that people spend more around the days their dividends arrive, across wealth, income and age groups. It isn’t impulse, and it isn’t people who are short of money. In the authors’ words it is “planned” excess sensitivity: investors choose dividend portfolios, expect the income and plan their spending around it. The dividend does a job. It replaces a decision to sell.
That job matters most when markets fall. A dividend that hasn’t been cut doesn’t ask you to sell anything; raising the same money by selling does, and a falling market is exactly where selling decisions go wrong. Do dividend investors actually sell less in a crash? I looked for evidence and found it only in fund marketing, so treat that part as plausible, not shown.
Now the other side of the same habit. Samuel Hartzmark and David Solomon looked at how individuals, funds and institutions trade around dividends and found that many treat dividends and price changes as separate things, “not fully appreciating that dividends result in price decreases”. They call it the dividend disconnect, and it shows up in prices: demand for dividends rises in periods of low interest rates and poor market performance, and that demand leads to lower returns for dividend-paying stocks. The habit that helps someone stick to a spending plan is the same habit that makes a dividend look like extra money. Both studies describe a separate mental pot for dividend income. Whether that helps or costs you depends on what you need the pot for.
What does a dividend increase signal?
A raised dividend is usually read as a message from management: we expect higher earnings. The data don’t support that reading. Roni Michaely, Stefano Rossi and Michael Weber found that “changes in the level of cash flows do not empirically follow changes in dividends”. What dividend changes signal instead is a change in how much the cash flows swing. A raise says the business has become steadier, not that it is about to grow. The survey by Brav and his co-authors points the same way: in managers’ own views there is “at most moderate support” for the signaling idea.
For a dividend investor that is not bad news. Steady cash flow is what keeps a dividend alive in a bad year. It just isn’t a growth forecast.
Do dividend stocks beat the S&P 500?
The best-known dividend index makes the cleanest test. The S&P 500 Dividend Aristocrats are the companies in the S&P 500 that have raised their dividend every year for at least 25 consecutive years.
Dividend Aristocrats vs. S&P 500 · annualized total return, USD
Over ten years the Aristocrats trailed the S&P 500 by 5.65 points a year; over twenty, by 0.1
Four windows, each with its own end date, so each is its own row. Amber: the ten-year gap.
Over the ten years to May 29, 2026 the Dividend Aristocrats returned 10.00% a year against 15.65% for the S&P 500, 5.65 points behind. Over twenty years to February 28, 2025 the two are within a tenth of a point, 10.4% against 10.5%. The answer depends on the window, and the windows end on different dates, so the rows are not one series.
Over the ten years to May 29, 2026, the Aristocrats returned 10.00% a year with dividends reinvested. The S&P 500 returned 15.65%. That is a large gap, more than five points a year, and it compounds. It hadn’t closed by September 30, 2026: 9.85% against 15.33%, in the index figures published by ProShares and State Street, which run funds that track the two indexes. Over the 20 years to February 28, 2025, the two finished within a tenth of a point, 10.4% against 10.5%. From the day the index went live, May 2, 2005, to March 31, 2025, the Aristocrats were slightly ahead, 10.49% against 10.35%.
You may have seen a longer history in which the Aristocrats beat the market comfortably since 1989. The years before 2005 in that history are back-calculated: the index didn’t exist yet, and its rules were applied to old data afterwards. I leave them out.
What the Aristocrats delivered over their live history is a calmer ride. In 2008 they lost 22% while the S&P 500 lost 37%. That is a real property. It just isn’t a reliably higher return.
So why the gap in the last decade? Because it was a technology decade, and dividend strategies tend to hold little technology. The clearest case is a high-dividend fund.
Sector weights, two State Street funds · as of September 30, 2026
The biggest bet in a high-dividend fund is the technology it doesn't hold: 3.5% against 39.7%
Sector weight in a high-dividend fund minus the weight in an S&P 500 fund, in percentage points. Amber: Information Technology. Real estate goes the other way, 24.7% against 1.7%.
The biggest bet in the high-dividend fund is the technology it doesn't hold: 3.5% against 39.7% in an S&P 500 fund. Real estate goes the other way, 24.7% against 1.7%, and consumer staples, utilities and materials also weigh much more. A dividend yield is not neutral: it pulls the portfolio away from the sectors that dominate the index.
Take a large US high-dividend fund, State Street’s SPDR Portfolio S&P 500 High Dividend ETF. In its fact sheet of September 30, 2026, information technology was 3.5% of the fund, against 39.7% of State Street’s S&P 500 fund. Real estate went the other way: 24.7% against 1.7%. When the video was recorded the technology figures were about 3% and 38%. State Street, which runs both funds, publishes these numbers; I use them as data, not as a recommendation. MSCI shows the same shape with its own indexes: information technology was 11.48% of the MSCI USA High Dividend Yield Index on September 30, 2026, against 39.50% of the MSCI USA.
In 2026 the broad market is the more concentrated of the two on a single sector. A dividend strategy is not less concentrated. It is concentrated somewhere else, and its biggest active bet is the absence of technology. When technology leads for a decade, that bet costs a lot. Nothing guarantees it leads the next one, and the gap can turn in either direction.
You’re not buying higher returns. You’re buying a different market, often a calmer ride, and a spending routine. My personal view: if a dividend habit is what keeps someone invested through a bad year, that habit is worth real money. Just know what you’re paying for. It is not extra return; it is a routine you can live with without doing anything.
The only fair test of any of this is total return, price change plus dividends, against a broad index fund over the same window. Why that is the yardstick for every fund, not just dividend funds, is in index funds vs active funds.
What is a safe payout ratio?
The payout ratio is the share of its earnings a company pays out as dividends. There is no level above which a cut is certain. A high ratio means less room: when earnings fall, a company already paying out most of them has to choose between its dividend and everything else.
Here is the number the video promises at the start. Across the highest-yielding fifth of large US stocks, the companies in the Russell 1000, the dividend took about 72% of earnings on average from 1983 to 2025; in the next fifth, about 49%. It comes from Hartford Funds and Wellington Management, The Power of Dividends, which is fund marketing from a company that sells dividend funds. It is the main figure in this article that rests on fund marketing alone. I use it because I found no better one, and I name it so you can weigh it.
The same report does not show that the highest-yielding fifth earned less. In its period-by-period figure for the S&P 500, the top fifth by yield beat the second fifth in five of the ten periods, the last of them 2020 to 2025. The yield isn’t the problem. The cut is, and the highest yields come with the least room before one. When a company stops paying, the market notices: in the classic study by Roni Michaely, Richard Thaler and Kent Womack, shares of companies that omitted their dividend fell about 7% over three days around the announcement. The study also reports a longer drift afterwards; I leave it out, because the three-day move is the cleaner figure.
Index providers write this into their rules. MSCI’s high-dividend indexes exclude the companies in the top 5% by payout ratio and those whose dividend per share has shrunk over five years. That is the industry’s own definition of a yield that may not last.
How to look it up for a company:
- Per share: dividends per share divided by earnings per share, both in the annual report. Many data sites show a ready-made payout ratio; check which earnings figure it uses.
- In cash: dividends paid, from the cash-flow statement, divided by free cash flow. Earnings can include items that bring in no cash; the dividend has to be paid in cash.
- REITs are the exception to reading it on earnings. A US REIT must distribute at least 90% of its taxable income to shareholders every year, so its payout ratio on earnings looks high by design. Compare its dividend with its cash flow instead.
A very high ratio, say around 70% of earnings, does not mean a cut is coming. It means there is less room when earnings fall, and that is worth knowing before the yield is. The gap between 72 and 49 is the gap between a dividend that’s a fact and one that’s a forecast.
How to start dividend investing
The order matters more than any stock list.
- Decide what the money is for. Income now, or wealth later. If it’s wealth later, you don’t need a dividend strategy at all; a broad index fund already receives the whole payout, the dividends in cash and the buybacks indirectly, wherever the share count actually falls.
- Fix the yardstick before you buy: total return, over the same window, against a broad index fund. It’s the only comparison that tells you what the income costs you.
- Go broad. Owning many payers is what protected income in 2020. A fund does that for you; how to compare funds on what matters is in how to pick an ETF.
- Filter on the payout ratio, not on the yield. A yield ranking sorts companies by how much room they have used up.
- Decide what happens to the cash. Reinvest it while you build, or take it when you need it. What reinvesting does over decades is easy to see in the compound calculator.
If what you actually want is a monthly cash flow rather than dividends as such, there is a second route: sell a small fixed percentage of a broad fund each month. You get the same money and you choose the timing. The honest trade-off is that in a falling market you sell more shares to raise the same amount. That is a routine for withdrawing money, not a verdict on a holding; whether a particular position should go is a different question, with its own article.
Are dividends taxed differently?
Structurally, yes, in most systems. A price gain is usually taxed when you sell, a dividend in the year you receive it. With a sale you choose the timing; with a dividend you don’t. In the United States, dividends are part of gross income under the tax code, and the Congressional Research Service puts the other half plainly: “Gains are not taxed until realized, benefitting from the deferral of taxes.”
Everything beyond that structure depends on where you live: rates, allowances, and what happens to dividends from abroad. One case comes up often enough to name. Most US-source income paid to investors outside the United States, dividends included, is subject to a 30% US withholding tax, which a tax treaty and a W-8BEN form can reduce; the value-investing article explains the form. Inside a fund, the fund’s country matters too, which is what fund domicile means. And funds come in two kinds, distributing (they pay the dividends out) and accumulating (they reinvest them inside the fund); which suits you is a tax question in your own country. Check the details with a qualified tax adviser before you decide.
The honest summary
Can you live off dividends? Yes, if the portfolio is large enough. The dividend was never the hard part. The portfolio behind it is.
Two things you can do tonight. Look up the payout ratio of anything you hold for its yield. And put your dividend fund’s 10-year total return next to a broad index fund’s, same window, both with dividends. If you still want the dividend fund after that, keep it, knowingly.
Dividends are real money. They’re just not extra money.
Keep going
Finished reading? Three places to go next
- Try it with your numbersCompound growth on your own numbers See the year your growth overtakes what you paid in, and where the balance ends.
- Read nextWhen to Sell Stocks: The Only Three Good Reasons If you would rather sell a small slice each month than wait for dividends, this is when selling makes sense at all.
- On YouTubeSubscribe on YouTube (opens YouTube in a new tab)New videos every Tuesday: one money question per episode, checked against the data.
Primary sources (37)
- 01SPDR S&P 500 ETF Trust fact sheet, Index Characteristics: S&P 500 index dividend yield 1.12% (June 30, 2026 edition, as read in August 2026) and 1.10% (September 30, 2026); sector weights and index total returns as of September 30, 2026, information technology 39.71%, real estate 1.70%, 10 years 15.33% a year — State Street Global Advisors, 2026 (the issuer of the fund)
- 02SPDR Portfolio S&P 500 High Dividend ETF, fund page: 30-day SEC yield 4.07% on August 13, 2026 and 4.35% on October 22, 2026 — State Street Global Advisors, 2026 (the issuer of the fund)
- 03SPDR Portfolio S&P 500 High Dividend ETF fact sheet, as of September 30, 2026: 30-day SEC yield 4.71%; sector weights, information technology 3.54%, real estate 24.72% — State Street Global Advisors, 2026 (the issuer of the fund)
- 04S&P 500 Q3 2025 buybacks release, 12 months to September 30, 2025: buybacks a record $1.020 trillion, dividends a record $664.9 billion, total shareholder return a record $1.685 trillion — S&P Dow Jones Indices, Howard Silverblatt, December 18, 2025
- 05S&P 500 Q4 2018 buybacks release, annual buybacks and dividends 2016 to 2018 (2018 buybacks $806.41 billion, dividends $456.31 billion) — S&P Dow Jones Indices, March 25, 2019
- 06S&P 500 Q4 2019 buybacks release, 2019 buybacks $728.7 billion and dividends $485.5 billion — S&P Dow Jones Indices, March 24, 2020
- 07S&P 500 Q4 2020 buybacks release: 'Full year 2020 buybacks were $519.7 billion, down 28.7% from 2019's $728.7 billion'; 2020 dividends $480.4 billion — S&P Dow Jones Indices, March 24, 2021
- 08S&P 500 Q4 2022 buybacks release, 2021 and 2022 buybacks and dividends — S&P Dow Jones Indices, March 21, 2023
- 09S&P 500 Q4 2024 buybacks release, 2023 and 2024 buybacks and dividends — S&P Dow Jones Indices, March 19, 2025
- 10U.S. common indicated dividend payments for Q4 2025 and 2025: '409 issues or 81.3% within the S&P 500 currently pay a dividend' — S&P Dow Jones Indices, January 7, 2026
- 11A YTD History of S&P 500 Dividend Increases, Cuts, and Suspensions: 62 decreases, 41 of them suspensions, in the first half of 2020 — Howard Silverblatt, S&P Dow Jones Indices, Indexology, July 13, 2020
- 12U.S. indicated dividend payments for Q4 2020: 'For 2020, the index set a record payment of $58.28 per share, slightly up from the prior record of 2019's $58.24' — S&P Dow Jones Indices, January 6, 2021
- 13Ex-Dividend Dates: When Are You Entitled to Stock and Cash Dividends, note on special dividends: 'With a significant dividend, the price of a stock may fall by that amount on the ex-dividend date.' — U.S. Securities and Exchange Commission, Investor.gov
- 14Analysis of Dividends and Share Repurchases, refresher reading 2026: the share price 'can be expected to drop by the amount of the dividend'; 'homemade dividends' given perfect markets — CFA Institute, 2026
- 15Marginal Stockholder Tax Rates and the Clientele Effect, The Review of Economics and Statistics 52(1), 68–74; average ex-day price drop of 77.7% of the dividend, New York Stock Exchange (figure as cited in later studies) — Edwin J. Elton and Martin J. Gruber, 1970
- 16Why do stock prices drop by less than the value of the dividend? Evidence from a country without taxes, Journal of Financial Economics 47(2), 161–188; Hong Kong, no tax on dividends or capital gains, average dividend HK$0.12, average price drop HK$0.06 — Murray Frank and Ravi Jagannathan, 1998
- 17Ex-dividend day trading: Who, how, and why? Evidence from the Finnish market, Journal of Financial Economics 88(2), 355–374; median ex-day price drop of 0.917 to 0.934 of the dividend, Finland, 1995–2002 (working-paper figures) — Elias Rantapuska, 2008
- 18Stock-Market Behavior on Ex-Dates: New Insights from German Stocks with Tax-Free Dividend, International Journal of Financial Studies 8(3), 58; tax-free dividends of CDAX constituents, January 2002 to September 2019, price-drop ratio 0.87, not significantly different from 1 — Felix Kreidl, 2020
- 19Dividend Policy, Growth, and the Valuation of Shares, The Journal of Business 34(4), 411–433 — Merton H. Miller and Franco Modigliani, 1961
- 20Payout Policy in the 21st Century, a survey of 384 CFOs and treasurers: 'managers are very reluctant to cut dividends'; repurchases 'more flexible than using dividends'; dividend increases and repurchases 'generally paid out of residual cash flow'; 'at most moderate support' for signaling — Alon Brav, John R. Graham, Campbell R. Harvey and Roni Michaely, NBER Working Paper 9657, 2003
- 21Consuming Dividends, The Review of Financial Studies 35(10), 4802–4857; bank data linking consumption and income to portfolios and survey responses, 'planned' excess sensitivity of consumption to dividend income — Konstantin Bräuer, Andreas Hackethal and Tobin Hanspal, 2022
- 22The Dividend Disconnect, The Journal of Finance 74(5), 2153–2199; investors 'not fully appreciating that dividends result in price decreases'; demand for dividends 'leading to lower returns for dividend-paying stocks' — Samuel M. Hartzmark and David H. Solomon, 2019
- 23Signaling Safety, Journal of Financial Economics 139(2), 405–427; 'changes in the level of cash flows do not empirically follow changes in dividends' — Roni Michaely, Stefano Rossi and Michael Weber, 2021
- 24S&P 500 Dividend Aristocrats, index page and factsheet; 10 years to May 29, 2026, 10.00% a year against 15.65% for the S&P 500 (as read in August 2026) — S&P Dow Jones Indices, 2026
- 25S&P 500 Dividend Aristocrats research, Exhibit 9c; 15 and 20 years to February 28, 2025 (as read in August 2026) — S&P Dow Jones Indices, March 2025
- 26Celebrating 20 Years of S&P 500 Dividend Aristocrats with 20 Fun Facts; 10.49% against 10.35% a year from launch on May 2, 2005 to March 31, 2025, and 2008 returns of −22% against −37% (as read in August 2026) — S&P Dow Jones Indices, 2025
- 27ProShares S&P 500 Dividend Aristocrats ETF, performance table; the index covers S&P 500 companies 'that have consistently increased dividends each year for at least 25 years', 9.85% a year over the 10 years to September 30, 2026 — ProShares, 2026 (the issuer of a fund that tracks the index)
- 28MSCI USA High Dividend Yield Index factsheet, information technology 11.48% (September 30, 2026) — MSCI, 2026
- 29MSCI USA Index factsheet, information technology 39.50% (September 30, 2026) — MSCI, 2026
- 30MSCI High Dividend Yield Indexes Methodology; excludes the top 5% of securities by payout ratio and those with negative five-year dividend-per-share growth; REITs are not eligible — MSCI, August 2025
- 31The Power of Dividends: Past, Present, and Future (fund marketing). Figure 6, average payout ratio of Russell 1000 stocks by dividend-yield fifth, 1983–2025, 72% for the highest-yielding fifth and 49% for the second; Figure 5, S&P 500 returns by dividend-yield fifth and decade — Hartford Funds and Wellington Management, 2026
- 32Price Reactions to Dividend Initiations and Omissions: Overreaction or Drift?, The Journal of Finance 50(2), 573–608; three-day price reaction to dividend omissions of −7.0% — Roni Michaely, Richard H. Thaler and Kent L. Womack, 1995
- 33Investor Bulletin: Real Estate Investment Trusts (REITs), a REIT 'must distribute at least 90 percent of its taxable income to shareholders annually in the form of dividends' — U.S. Securities and Exchange Commission, Office of Investor Education and Advocacy
- 34NRA withholding, 'Most types of U.S. source income received by a foreign person are subject to U.S. tax of 30%', lower under a tax treaty; Form W-8BEN — Internal Revenue Service
- 35Fixed, determinable, annual, or periodical (FDAP) income, which includes 'Dividends and dividend equivalent payments'; 'Tax at a 30% (or lower treaty) rate applies to FDAP income or gains from U.S. sources' — Internal Revenue Service
- 36Capital Gains Taxes: An Overview of the Issues (R47113), 'Gains are not taxed until realized, benefitting from the deferral of taxes.' — Jane G. Gravelle, Congressional Research Service, May 24, 2022
- 3726 U.S. Code § 61(a)(7), dividends are part of gross income — Legal Information Institute, Cornell Law School
Questions people actually ask
How much do you need to live off dividends?
It depends on the yield, and the yield decides which plan you are actually choosing. For $2,000 a month, or $24,000 a year before tax, you need about $2.14 million at the S&P 500's index dividend yield of 1.12% (State Street fact sheet, June 30, 2026), and about $590,000 at a high-dividend fund yielding 4.07% (30-day SEC yield, August 13, 2026). With the yields of autumn 2026, 1.10% on September 30 and 4.35% on October 22, it is about $2.18 million and about $552,000. The second portfolio is smaller because it holds a different, narrower set of companies chosen for their yield. Yields change daily and a fund's own yield differs from the index figure, so this is a calculation with current numbers, not a forecast.
Are dividends free money?
No. A dividend is real money, but it is paid out of the company's value, and on the ex-dividend day the share price typically falls by about the dividend. Most studies find the fall to be smaller than the full dividend, by an amount that depends on market and period: about half in Hong Kong from 1980 to 1993, a market without taxes on dividends or capital gains (Frank and Jagannathan), 77.7% on the New York Stock Exchange in the 1960s (Elton and Gruber, as cited in later studies), and a median of 92% to 93% in Finland from 1995 to 2002 (Rantapuska). A dividend converts part of what you own into cash; it does not add to it.
Why is the S&P 500's dividend yield so low?
Because most of what S&P 500 companies pay their owners goes out as buybacks, not dividends. In the 12 months to September 30, 2025, they paid $1.685 trillion in total: $664.9 billion in dividends (39.5%) and $1.020 trillion in buybacks, according to S&P Dow Jones Indices. Buybacks were larger than dividends in every year from 2016 to 2024. An index fund holder receives the dividend in cash and the buyback indirectly, through a smaller share count, where the count actually falls.
Do dividend stocks beat the S&P 500?
Not reliably. The S&P 500 Dividend Aristocrats returned 10.00% a year over the 10 years to May 29, 2026, against 15.65% for the S&P 500 (S&P Dow Jones Indices); on September 30, 2026 the ten-year figures were 9.85% against 15.33% (index figures published by ProShares and State Street). Over the 20 years to February 28, 2025, the two were within a tenth of a point, 10.4% against 10.5%. The gap of the last decade came largely from technology: in the fact sheets of September 30, 2026, a large US high-dividend fund held 3.5% in information technology against 39.7% in an S&P 500 fund. What the Aristocrats offered over their live history is a calmer ride, not a reliably higher return.
What is a safe payout ratio?
There is no level that guarantees a dividend, but a high payout ratio leaves less room when earnings fall. According to Hartford Funds and Wellington Management (The Power of Dividends, a fund company's publication), the highest-yielding fifth of large US stocks in the Russell 1000 paid out about 72% of earnings on average from 1983 to 2025, against about 49% in the next fifth. Index providers screen for it: MSCI's high-dividend indexes exclude the companies with the highest payout ratios. For US REITs the ratio on earnings reads high by design, because they must distribute at least 90% of their taxable income each year.
How do you start dividend investing?
Start with the order, not with a stock list. First decide whether the money is for income now or for wealth later. Then fix total return, price change plus dividends, as the yardstick and compare any dividend fund with a broad index fund over the same window. Go broad rather than concentrated, use the payout ratio as a filter rather than ranking by yield, and decide in advance whether dividends are reinvested or paid out. This is general education, not personal advice.
Should you reinvest dividends or take the cash?
If you don't need the income yet, reinvesting keeps the whole payout working. If you need the cash, taking it is the point of the strategy. In many tax systems a dividend is taxable in the year it is paid whether you reinvest it or not, so check the rules where you live before choosing between a distributing and an accumulating fund.
Are dividends taxed differently from capital gains?
Structurally, yes, in most systems: a price gain is usually taxed only when you sell, while a dividend is taxed in the year you receive it, so with a sale you choose the timing and with a dividend you don't. In the US, dividends count as gross income (26 U.S.C. § 61(a)(7)). Rates, allowances and withholding on foreign dividends depend on where you live; most US-source income paid to foreign investors, dividends included, is subject to a 30% US withholding tax, which a tax treaty and a W-8BEN form can reduce. Check the details with a qualified tax adviser.