Index Fund Risk: How Concentrated Is Your S&P 500 Fund, Really?
Index fund risk you can check: an S&P 500 fund holds 500 companies, but its money is spread like fewer than 50. The paperwork, every number sourced.
The S&P 500 Isn't as Diversified as You Think (It Acts Like 48 Stocks)
Prefer to watch? This article is the written companion to the video above.
You own an S&P 500 index fund, or you are about to buy one, and somewhere you read that it isn’t as diversified as it looks. That is true, and it is not a reason to sell. This page is about the risk you actually carry, measured from the fund’s own paperwork: how lopsided the money is, what the law calls “diversified”, why two of the largest fund companies asked their shareholders to give the word up, and what each of the usual fixes really changes.
Every number here has a date next to it. The concentration figures move with prices, and one of them has already moved since the video was recorded.
Is the S&P 500 diversified?
It depends on which question you mean. Diversification is how many things you own. Concentration is how evenly you own them. The S&P 500 does very well on the first and badly on the second, at the same time.
There is a standard way to put a number on the second question. S&P Dow Jones Indices publishes a Herfindahl-Hirschman Index for the S&P 500: square each company’s weight in percent, add the squares up. A portfolio of one stock scores 10,000. A hundred stocks of equal weight score 100, fifty score 200. On July 31, 2026 the S&P 500 scored 210.5, a little above the fifty. Divide 10,000 by it and you get 47.5 (my own conversion, not a figure S&P publishes): the index’s money was spread like about 48 stocks of equal weight, the 48 in the video above.
I ran the same sum on the published holdings of a large S&P 500 fund on November 5, 2026: 217.0, or about 46. Slightly more concentrated than in July, not less.
None of the 500 has gone missing. The money is stacked so unevenly that it is spread like 46 to 48 equal stocks.
Your $100,000, taken apart
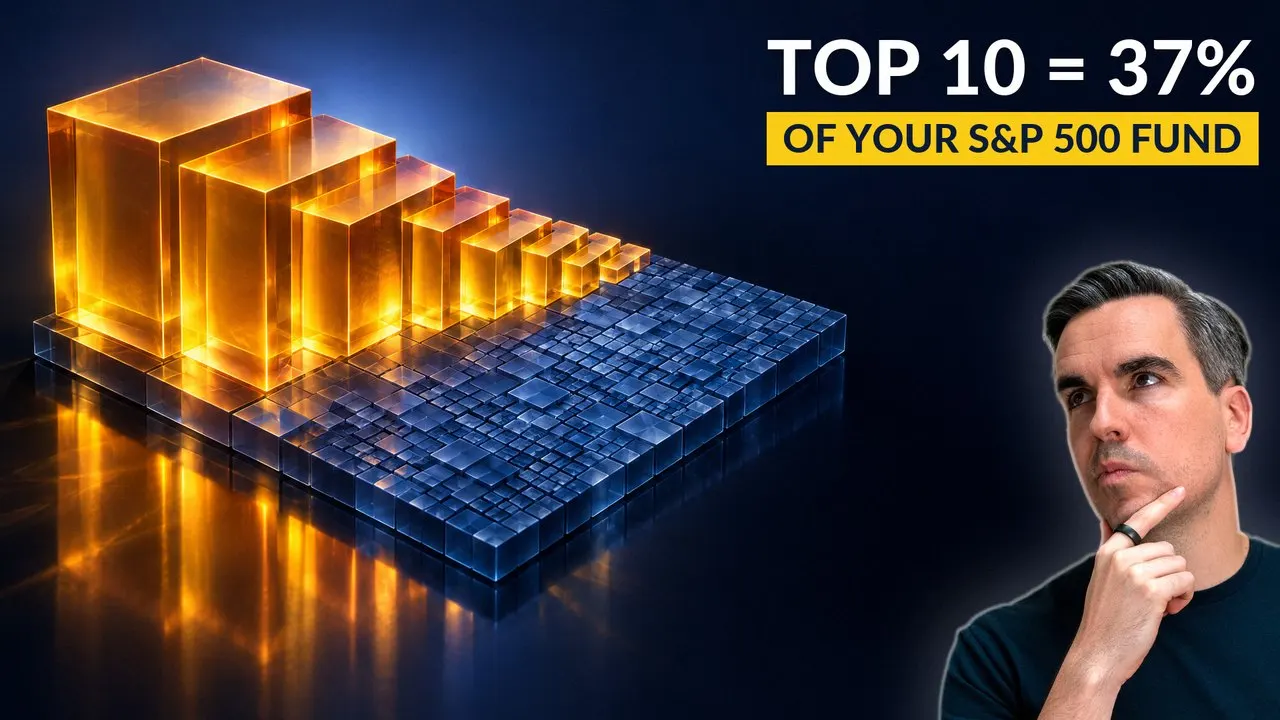
Percentages don’t land until they are money. Here is $100,000 in that fund on November 5, 2026.
S&P 500 index fund · $100,000 by position, November 5, 2026
Of $100,000, the 10 largest positions take $37,560 and the other 493 share the rest
Area is money. Amber: the 10 largest positions at their real weights. Each grey tile: one of the other 493, drawn at their average of about $126.
The largest position, Apple, takes about $7,920. NVIDIA takes $6,930, Microsoft $6,270. The 10 largest positions together hold $37,560, and the other 493 share $62,340, about $126 each on average. The video uses holdings from August 2026 and rounds the same split to $8,000, $7,000 and $37,000, with NVIDIA rather than Apple in first place. The order changed; the shape didn’t.
A note on sources, because the dates come from two places. The November figures on this page are calculated from the daily holdings of one large S&P 500 fund, the August figures from another; both are named in the sources. Both track the same index, so their weights are close but not identical, and each figure carries the date and fund it belongs to. An S&P 500 index fund in your 401(k) tracks the same index too, so its weights will be close to these; its own fact sheet has the exact figure.
One detail decides whether a quoted top-10 figure is right: a holdings list counts positions, not companies. Alphabet is in it twice, as class A and class C shares. Counted by company, the 10 largest held 39.1% on November 5, 2026, not 37.6%. Both numbers are correct. They just answer different questions, and an article that mixes them is wrong by a percentage point and a half.
Nothing here is hidden. Every number comes from a list the fund publishes each day. It is simply not the number anyone quotes when they say “500 companies”.
What is a market cap weighted index?
A market cap weighted index holds each company in proportion to its stock market value (strictly, the value of the shares available to trade). If a company is worth 5% of the total value of all 500, it gets 5% of your money. Nobody at the index provider decides that a company deserves a bigger slice; the market’s own prices decide.
This design has one property that makes it cheap to own, and the same property produces the concentration. When a company’s share price rises, its weight in the index rises by exactly the same amount as its weight in the market. The fund doesn’t need to buy anything to keep up. It already owns the right amount, because the holding grew by itself. A market cap index rebalances itself through prices; trading is needed mainly when a company enters or leaves the index, or when its number of shares changes. That is a large part of why an S&P 500 fund can charge so little.
Now follow the same logic to its end. When a handful of companies become very large, an index that owns the market the way the market owns itself becomes very concentrated in that handful. It doesn’t fail when that happens. It is doing what it was built to do.
So the fund never promised to spread your money evenly. It promised to own the market in the market’s own proportions. You still own 500 companies. You just don’t own them evenly, and that was always the deal.
What “diversified” legally means for a US fund
On a US fund, “diversified” isn’t a description. It is a legal status defined in the Investment Company Act of 1940, and the wording is worth reading once. Under 15 U.S.C. § 80a-5(b)(1), a “diversified company” is a fund where:
“At least 75 per centum of the value of its total assets is represented by cash and cash items (including receivables), Government securities, securities of other investment companies, and other securities for the purposes of this calculation limited in respect of any one issuer to an amount not greater in value than 5 per centum of the value of the total assets of such management company and to not more than 10 per centum of the outstanding voting securities of such issuer.”
Three quarters of the fund has to sit in holdings of at most 5% each. The last quarter is not limited by this rule at all. Every holding above 5% has to fit, in full, into that quarter.
On August 27, 2026, four companies were each above 5% of a large S&P 500 fund: NVIDIA 8.03%, Apple 6.87%, Alphabet 5.47% with both share classes together, and Microsoft 5.40%. Together 25.77%, just over the 25% that the free quarter allows. That is the “25.8% against the ceiling of 25” in the video (my own calculation from published holdings, at company level).
This number moves, and it has already fallen back below the line. On November 5, 2026, only three companies were above 5%: Apple 7.92%, NVIDIA 6.93% and Microsoft 6.27%, together 21.12%. Alphabet, with both classes, was at 4.72%. The next price move can take it back over.
Being slightly over is not a violation either way. A second provision, § 80a-5(c), says a diversified fund does not lose the status because of a later gap between the values of its holdings and the rule, as long as that gap is not the result of its own purchase. A position that grows past the line because its price went up is fine. An index fund that keeps buying those companies with new money relies on more than this; that is what the 2019 letter below is about.
The second ceiling is in the tax code, and it applies to every fund taxed as a regulated investment company, including those that call themselves non-diversified. Under 26 U.S.C. § 851(b)(3), at the close of each quarter at least half of the fund’s assets must sit in positions of at most 5%, and no more than 25% may be invested in any single issuer (government securities and other funds are exempt). Here too, a gap caused only by later price changes doesn’t count against the fund (§ 851(d)). So “non-diversified” does not mean unlimited.
Here is the calculation that most discussions of this get backwards. How much could a fund that keeps the “diversified” label legally put into its ten largest positions? Take one company at the 25% tax ceiling and nine at 5% each: that is about 70% in ten companies, and the fund is still diversified (my own calculation; under a looser reading of how the part above 5% is counted, up to about 75%). A large S&P 500 fund had 39.1% in its ten largest companies on November 5, 2026. The legal room is about double the actual concentration. A common claim online is that the rulebook stops active managers from owning enough of the biggest companies. The numbers say otherwise.
How many funds are non-diversified anyway? The SEC’s count for 2020: 9,719 of 12,454 registered funds were diversified, about 78%. By assets, the non-diversified ones held $2.132 trillion, about 9% of the $24.609 trillion total. Those figures cover all registered funds; there is no published breakdown for US large-cap stock funds alone, so I won’t give one.
The paper trail: Vanguard, Fidelity and a letter from 2019
The rule doesn’t bind a broad S&P 500 fund today. It has bound narrower index funds, and the fund companies said so in writing.
The paper trail · regulator and fund companies, 2019 to 2026
The problem was on file with the SEC's staff in June 2019, six years before Vanguard asked its shareholders
Dots sit on a true calendar scale. Amber: the 2019 letter.
- 1 June 24, 2019 · SEC staff, no-action letter. As the applicants put it, a few constituents of large-cap growth indexes “have grown to each represent more than 5% of the Affected Index”.
- 2 2023 · Fidelity. Shareholders of 13 funds are asked to approve the change to non-diversified. The source gives the year, not the dates.
- 3 May 2025 · Fidelity. VIP Growth Opportunities follows.
- 4 August 25, 2025 · Vanguard. Two sector index funds, put to a shareholder vote: the benchmarks “have become increasingly concentrated in a small number of stocks”. Approved on November 4, 2025 and January 6, 2026.
- 5 January 14, 2026 · Fidelity. Shareholder meeting for Advisor Growth Opportunities, an active fund; non-diversified from February 1, 2026.
- 6 September 2026 · Fidelity. The board approves the same change for an index fund, SAI Emerging Markets Value Index, subject to a shareholder vote expected in early 2027.
In June 2019 the SEC’s staff granted no-action relief to index funds whose benchmarks had grown too concentrated for the 5% rule: it would not recommend enforcement action against an index fund that exceeds the diversified limits for that reason. The request, filed by the law firm Stradley Ronon, described the problem in one sentence, as the staff’s letter summarizes it:
“You state that during the past year, a few constituents of certain large cap U.S. equity growth broad-based indices … have grown to each represent more than 5% of the Affected Index and, in the aggregate, close to or, in some cases, more than 25% of the Affected Index at certain times.”
The examples the letter lists are growth indexes, such as the S&P 500 Growth Index and the Russell 1000 Growth Index, not the S&P 500 itself. That was six years before Vanguard’s announcement below. The concentration you are reading about now was on record in the regulator’s correspondence, for growth indexes, before most index investors had heard of it. I find that the calmer frame, and the more accurate one: this is not something new breaking, it is something long announced arriving.
On August 25, 2025, Vanguard announced that it intended to change two of its sector index funds, the Health Care Index Fund and the Financials Index Fund, from diversified to non-diversified, and put it to a shareholder vote. The press release gave the reason in full:
“Currently, the diversification limits constrain funds’ ability to directly invest in securities in proportion to their weights in their respective benchmarks, as the benchmarks have become increasingly concentrated in a small number of stocks.”
Shortened versions of that sentence often stop after “benchmarks”. The half that follows is the whole explanation. The rule that exists to keep a fund diversified had started getting in the way of tracking the index. So the rule went: shareholders approved the change for the Financials Index Fund on November 4, 2025, and, after the meeting was adjourned, for the Health Care Index Fund on January 6, 2026. Note the word sector: neither of these was a broad market fund like an S&P 500 fund.
Fidelity has gone further. On January 14, 2026, shareholders of the Fidelity Advisor Growth Opportunities Fund voted to make it non-diversified, effective February 1, 2026. Fidelity’s shareholder Q&A gave the reason plainly:
“Reclassifying the fund as non-diversified will give the fund’s portfolio managers increased flexibility to invest a greater percentage of the fund’s assets in fewer issuers or any one issuer.”
It was not the first. According to the same Q&A, shareholders of 13 Fidelity funds were asked to approve the change in 2023, and VIP Growth Opportunities followed in May 2025: 14 funds asked before this one. Advisor Growth Opportunities is an actively managed growth fund, not an index fund, which makes the point from the other side: a manager who picks stocks freely wanted more room in fewer companies than the diversified label allows.
In September 2026 it reached a plain index fund at Fidelity as well. The board approved, subject to a shareholder vote expected in the first quarter of 2027, making the Fidelity SAI Emerging Markets Value Index Fund non-diversified. The filing states the rule in one line, the same way the video does: “the aggregated total of single-issuer positions of 5% or more of the fund’s total assets cannot exceed 25% of the fund’s total assets.”
Then there is the fund you probably own. The summary prospectus of the iShares Core S&P 500 ETF, one of the largest S&P 500 funds, dated July 31, 2026, says this about itself:
“The Fund intends to be diversified in approximately the same proportion as the Underlying Index is diversified … The Fund may become “non-diversified,” as defined in the 1940 Act, solely as a result of a change in relative market capitalization or index weighting of one or more components of the Underlying Index. Shareholder approval will not be sought if the Fund becomes “non-diversified” due solely to a change in the relative market capitalization or index weighting of one or more components of the Underlying Index.”
In plain words: if the index gets concentrated enough, the fund will follow it across the line, without a vote, and it told you so before you bought it. That is the difference to Vanguard’s sector funds, which needed a vote. The fund’s statement of additional information names the basis: “applicable no-action relief from the SEC staff”, relief of the kind the 2019 letter above granted. I’ve quoted one fund’s prospectus because the sentence has to be checkable; it is a citation, not a recommendation. Your own fund’s prospectus will say how it handles the same question. Nobody in this story did anything wrong. Every fund company here solved a real problem in public and wrote down why.
In nearly two decades in the financial industry I have watched limits like these get hit from the inside, and it is less dramatic than it reads. It is a line in a monitoring report that turns amber, followed by a meeting about whether to trim a position that has done nothing wrong except grow.
Is this a record?
No, and the honest version is more interesting. Tim Edwards of S&P Dow Jones Indices, in “In the Shadows of Giants”, writes that by mid-2025 the 10 largest companies in the S&P 500 “represented almost 40% of the index, a level of concentration not seen since the mid-1960s”. Not seen since is different from never seen. His quarterly data starts in June 1965, when the top 10 were about this heavy, and in all the decades between it was lower. The data says nothing about earlier years, and nobody can tell you whether or when it comes down again.
There is one uncomfortable part, and it is what the comment section always asks: does the money pouring into index funds push the biggest companies up by itself? A study published in 2025 says it does. Jiang, Vayanos and Zheng, in the Review of Financial Studies (December 2025), find that “flows into passive funds disproportionately raise the stock prices of the economy’s largest firms, especially those large firms in high demand by noise traders”, and that the market as a whole can rise even when the flows are only investors switching from active to passive funds. Index funds held 54.5% of US long-term fund assets in September 2026 (Investment Company Institute), and the true passive share of the stock market is higher than index fund statistics show: Chinco and Sammon estimate that “while index funds held 16% of the US stock market in 2021, we put the overall passive ownership share at 33.5%”. Some of this crowding is self-inflicted, including by you and by me.
Would an active fund avoid index fund risk?
So pay someone to hold something different. An active manager is free to hold less of the biggest companies; that part is easy. The question is whether you can pick one who does it and stays ahead of the index.
Take the US large-cap funds that finished 2021 in the top quarter of their category: 164 of them, according to the U.S. Persistence Scorecard, Year-End 2025, from S&P Dow Jones Indices. After 12 months, 20.12% were still in the top quarter. Then the scorecard asks a harder question: how many were in the top quarter at every year-end after that? At the end of 2023, 2024 and 2025 the answer was 0.00%. Not a small number. None.
The same report runs a second test, and it answers a different question. It compares two separate five-year periods: of the 159 large-cap funds in the top quarter for December 2015 to December 2020, 13.84% were in the top quarter again for December 2020 to December 2025. If you are asked “how many good funds stayed good?”, 0.00% and 13.84% are both true answers to two differently built tests. Quote one without its test and someone will correctly call it wrong.
The second problem is that the fund you pick may not be there to judge. Of all US large-cap funds that existed 20 years before the end of 2025, 34.61% still existed at the end of it (SPIVA U.S. Scorecard, Year-End 2025). Two out of three were merged into other funds or closed.
The SPIVA figures that usually get quoted count funds: each fund counts once, however large it is. Counting dollars instead changes one of these four periods, and only one.
| Period | Funds that trailed | Active dollar, a year | S&P 500, a year |
|---|---|---|---|
| 1 year (2025) | 78.78% | 18.03% | 17.88% |
| 5 years | 88.96% | 12.52% | 14.42% |
| 10 years | 85.59% | 13.64% | 14.82% |
| 20 years | 92.89% | 9.62% | 11.00% |
SPIVA U.S. Scorecard, Year-End 2025, all periods to December 31, 2025. “Funds that trailed”: share of active US large-cap funds behind the S&P 500. “Active dollar”: the asset-weighted return of all active large-cap funds, annualized.
In 2025 most active funds trailed the index while the average active dollar beat it, because the money isn’t spread evenly across funds either. Over 5, 10 and 20 years the dollars trail as well. The 2025 figure cuts against the usual story about active funds. It does, for one year.
The longer comparison, including what is still worth paying a manager for, is in index funds against active funds. One more number belongs here, because it is the price of trying: in 2025, asset-weighted expense ratios were 0.64% for active stock mutual funds against 0.05% for index stock mutual funds, and 0.44% for active stock ETFs against 0.14% for index stock ETFs (Investment Company Institute, March 2026). What that difference removes over 20 years is a calculation you can run with your own numbers.
The real constraint on a manager who wants to avoid the crowd isn’t the rulebook. It is the plumbing. Equity mutual funds held 1.5% of their assets in liquid assets in September 2026 (Investment Company Institute; the video quotes the earlier 1.6%), and the law gives a fund seven days to pay you out. Under 15 U.S.C. § 80a-22(e), no registered fund may “postpone the date of payment or satisfaction upon redemption … for more than seven days after the tender of such security”, with exceptions for exchange closures, emergencies and SEC orders. There is no rule that sets a minimum cash level; the SEC’s 2022 proposal for a minimum of highly liquid assets was not adopted. A manager who decides the market is too crowded has to sell into the crowd first, sit on the cash while what he sold keeps rising, and then explain a year of trailing the index to people who can leave on any Tuesday. That is a nerve problem more than an intelligence problem. The same mechanism, seen from the investor’s side, is the subject of forced selling.
Would going global or equal weight fix it?
Two fixes get offered. Neither is one.
Going global nearly halves the concentration and doesn’t remove it. On August 27, 2026, the 10 largest positions held 37.18% of a large US index fund and 20.71% of a total world fund, both calculated from published holdings on the same basis: a reduction of 44%. Counted by company it was 38.64% against 21.62%.
10 largest positions · share of the fund, August 27, 2026
Going global cut the top 10 from 37.2% to 20.7% of the fund: nearly half, and still a fifth of the money
Each square is one whole fund. Amber: what its 10 largest positions hold.
The 10 largest positions are still about a fifth of the world fund, because the largest US companies are also among the largest companies in the world.
Equal weighting isn’t a return to neutral either. An equal-weight S&P 500 fund holds each company at the same weight and has to sell what has risen and buy what has fallen to stay that way. That is a bet that the largest companies will do worse than the rest. It costs turnover, and it wins in some decades and loses in others. It feels neutral because it sounds fair. It is a position.
So the one decision worth making isn’t which fund to buy. It is whether you want your money to follow the world’s biggest companies or the world’s companies. Both are defensible.
How to check the concentration in your own fund
Three checks, about five minutes in total. This is general education, not personal advice; your situation is your own.
Search the prospectus for “non-diversified”. If the word isn’t there, your fund is still inside the old rule. If it is, the fund may hold more than a quarter of its money in companies above 5% each; the 25% ceiling per single company from the tax code still applies. That isn’t a warning that something is wrong. It is a departure from the old rule, and it happened in writing: by a shareholder vote, or, in an index fund like the one quoted above, by a sentence in the prospectus.
Find the top-10 weight. It is on the first page of almost every fund fact sheet, and it says more than the number of holdings. Five hundred positions tell you almost nothing on their own. Check whether the figure counts positions or companies. There is no official good or bad level. Two reference points from this page: about 37% for an S&P 500 fund and about 21% for a total world fund (August 2026).
If you want less concentration, redirect new money before you sell old money. In many countries selling an investment that has gained triggers tax. The tax is certain; the benefit of the switch isn’t. Have that part checked for your own situation before you act.
The short answer
Your S&P 500 fund is still diversified. It is also more concentrated than “500 companies” suggests: about 46 to 48 equal stocks’ worth, depending on the date, with more than a third of the money in ten positions. That is the method working, not the fund failing. Keep the shape in mind, not the headline. Knowing the shape is what lets you stop opening the app to check whether something changed while you weren’t looking.
Keep going
Finished reading? Three places to go next
- Try it with your numbersWhat your fund fees actually cost Set a fund’s fee against a low-cost index fund and see what it removes from the final balance.
- Read nextIndex Funds vs Active Funds: 98% Lost to Their Index The scorecards on active funds, and what is still worth paying a manager for.
- On YouTubeSubscribe on YouTube (opens YouTube in a new tab)New videos every Tuesday: one money question per episode, checked against the data.
Primary sources (22)
- 01Index Investment Strategy Dashboard: S&P 500 Factor Indices: Herfindahl-Hirschman Index of the S&P 500 of 210.5 as of July 31, 2026, with reference values of 10,000 for a single stock and 100 for 100 equally weighted stocks; 47.5 equivalent stocks is the author's own conversion (10,000 ÷ 210.5) — S&P Dow Jones Indices, 2026
- 02SPDR S&P 500 ETF Trust, daily holdings as of November 5, 2026, used for the author's own calculation: 503 stock positions, top-10 positions 37.56%, top-10 companies 39.08%, companies above 5% Apple 7.92%, NVIDIA 6.93%, Microsoft 6.27% (together 21.12%), Alphabet class A and C together 4.72%, Herfindahl-Hirschman Index 217.0 (about 46 equivalent stocks) — State Street Global Advisors, 2026
- 03iShares Core S&P 500 ETF, published holdings as of August 27, 2026, used for the author's own calculation: companies above 5% NVIDIA 8.03%, Apple 6.87%, Alphabet (A and C) 5.47%, Microsoft 5.40%, together 25.77%; top-10 positions 37.18%, top-10 companies 38.64% — BlackRock, 2026
- 04Vanguard Total World Stock ETF, published holdings as of August 27, 2026, used for the author's own calculation: top-10 positions 20.71%, top-10 companies 21.62% — Vanguard, 2026
- 05Investment Company Act of 1940, section 5(b)(1) and 5(c): definition of a diversified company (75%, 5%, 10%) and retention of the status when values change — 15 U.S.C. § 80a-5, Legal Information Institute
- 06Internal Revenue Code, section 851(b)(3): diversification test for regulated investment companies, including the 25% limit for a single issuer — 26 U.S.C. § 851, Legal Information Institute
- 07Investment Company Act of 1940, section 22(e): payment on redemption within seven days — 15 U.S.C. § 80a-22, Legal Information Institute
- 08No-action letter to Stradley Ronon Stevens & Young: 'You state that during the past year, a few constituents of certain large cap U.S. equity growth broad-based indices … have grown to each represent more than 5% of the Affected Index and, in the aggregate, close to or, in some cases, more than 25% of the Affected Index at certain times'; examples include the S&P 500 Growth Index and the Russell 1000 Growth Index — U.S. Securities and Exchange Commission, Division of Investment Management, June 24, 2019
- 09Press release: intent to change the Health Care Index Fund and the Financials Index Fund from diversified to non-diversified, subject to a shareholder vote, with the full reason quoted in this article — Vanguard, August 25, 2025
- 10Vanguard World Fund, Form N-CSRS, Item 9: shareholders approved the change to non-diversified for Vanguard Financials Index Fund on November 4, 2025 and for Vanguard Health Care Index Fund on January 6, 2026 — Vanguard, filed April 29, 2026
- 11Shareholder Q&A, Fidelity Advisor Growth Opportunities Fund: shareholder meeting January 14, 2026 on reclassifying the fund as non-diversified, effective February 1, 2026; shareholders of 13 Fidelity funds asked to approve the same change in 2023, VIP Growth Opportunities effective May 1, 2025 — Fidelity Investments, January 15, 2026
- 12Supplement to the summary prospectus, Fidelity SAI Emerging Markets Value Index Fund: board approval in September 2026, subject to a shareholder vote expected in the first quarter of 2027, to reclassify the fund as non-diversified; 'the aggregated total of single-issuer positions of 5% or more of the fund's total assets cannot exceed 25% of the fund's total assets' — Fidelity, filed September 29, 2026
- 13iShares Core S&P 500 ETF, summary prospectus dated July 31, 2026, Principal Investment Strategies: diversified in approximately the same proportion as the Underlying Index; may become non-diversified solely as a result of a change in relative market capitalization or index weighting, without seeking shareholder approval; the statement of additional information names the SEC staff's no-action relief as the basis — iShares Trust, filed July 31, 2026
- 14Staff Report to Congress: Threshold Limits for Diversified Funds, tables 1 and 2: in 2020, 9,719 of 12,454 funds diversified; assets $22.476 trillion diversified against $2.132 trillion non-diversified — U.S. Securities and Exchange Commission, February 22, 2022
- 15In the Shadows of Giants: 'By mid-2025, the largest 10 companies in the S&P 500 represented almost 40% of the index, a level of concentration not seen since the mid-1960s'; quarterly data from June 1965 to June 2025, Alphabet's share classes counted as one company (reprinted in Vanguard's 'Partner Perspectives') — Timothy Edwards, S&P Dow Jones Indices, 2026
- 16Passive Investing and the Rise of Mega-Firms, Review of Financial Studies 38(12), 3461–3496, abstract: 'Flows into passive funds disproportionately raise the stock prices of the economy's largest firms, especially those large firms in high demand by noise traders. Because of this effect, the aggregate market can rise even when flows are entirely due to investors switching from active to passive funds.' — Hao Jiang, Dimitri Vayanos and Lu Zheng, December 2025
- 17The passive ownership share is double what you think it is, Journal of Financial Economics 157, article 103860: 'While index funds held 16% of the US stock market in 2021, we put the overall passive ownership share at 33.5%' — Alex Chinco and Marco Sammon, 2024
- 18Release: Active and Index Investing, September 2026: index mutual funds and ETFs 54.5% of long-term fund assets ($22.14 trillion index against $18.47 trillion active) — Investment Company Institute, October 30, 2026
- 19SPIVA U.S. Scorecard, Year-End 2025: share of active large-cap funds trailing the S&P 500 (78.78% over 1 year, 88.96% over 5, 85.59% over 10, 92.89% over 20); equal- and asset-weighted fund returns; large-cap fund survivorship of 34.61% over 20 years — S&P Dow Jones Indices, 2026
- 20U.S. Persistence Scorecard, Year-End 2025: Report 1 (three consecutive 12-month periods, cohort December 2023), Report 2 (five consecutive 12-month periods, cohort December 2021: 164 top-quartile large-cap funds, 20.12% then 0.00%), Report 5 (two non-overlapping five-year periods: 13.84% of 159) — S&P Dow Jones Indices, 2026
- 21Trends in the Expenses and Fees of Funds, 2025: asset-weighted expense ratios of 0.64% for active and 0.05% for index equity mutual funds, 0.44% for active and 0.14% for index equity ETFs (figures 6 and 7) — Investment Company Institute, March 2026
- 22Trends in Mutual Fund Investing, September 2026: 'The liquidity ratio of equity funds (the percentage of liquid assets over total net assets) was 1.5 percent in September' — Investment Company Institute, October 29, 2026
Questions people actually ask
Is the S&P 500 diversified?
By number of holdings, yes: about 500 companies. By how evenly the money is spread, much less. S&P Dow Jones Indices put the S&P 500's Herfindahl-Hirschman Index at 210.5 on July 31, 2026; 10,000 divided by 210.5 is about 47.5, so the index's money was spread like roughly 48 stocks of equal weight. Calculated the same way from the holdings of a large S&P 500 fund on November 5, 2026, it was about 46. On that date the 10 largest positions held 37.6% of the fund.
What is a market cap weighted index?
An index that holds each company in proportion to its stock market value, usually the value of the shares available to trade. When a company's price rises, its weight rises with it, so the index stays in line with the market without trading; trading is needed mainly when companies enter or leave the index or their share counts change. That makes such an index cheap to track. The same property means that when a few companies become very large, the index becomes concentrated in them.
What does 'diversified' mean for a US mutual fund or ETF?
It is a legal status under the Investment Company Act of 1940 (15 U.S.C. § 80a-5(b)(1)): at least 75% of the fund's assets must be in cash, government securities, other funds and holdings of no more than 5% of the fund's assets and 10% of the issuer's voting shares each. The remaining 25% is not limited by that rule. A fund does not lose the status because of a later gap between the values of its holdings and the rule, as long as the gap is not the result of its own purchase (§ 80a-5(c)). Separately, the tax rules for regulated investment companies (26 U.S.C. § 851(b)(3)) cap any single issuer other than the government or another fund at 25% of assets at each quarter-end, for diversified and non-diversified funds alike, again with an exception for gaps caused only by later price changes (§ 851(d)).
Can an S&P 500 index fund become non-diversified?
Yes. The summary prospectus of the iShares Core S&P 500 ETF (July 31, 2026) states that the fund 'may become "non-diversified," as defined in the 1940 Act, solely as a result of a change in relative market capitalization or index weighting of one or more components of the Underlying Index', and that shareholder approval will not be sought in that case. On August 27, 2026, four companies were each above 5% of one large S&P 500 fund, together 25.77%; on November 5, 2026, in another, three were, together 21.12%. Vanguard announced on August 25, 2025 that it would ask shareholders to change two sector index funds to non-diversified because their benchmarks had 'become increasingly concentrated in a small number of stocks'; shareholders approved on November 4, 2025 and January 6, 2026.
Is S&P 500 concentration at a record high?
No. In 'In the Shadows of Giants', Tim Edwards of S&P Dow Jones Indices writes that by mid-2025 the 10 largest companies in the S&P 500 represented almost 40% of the index, 'a level of concentration not seen since the mid-1960s'. His quarterly data begins in June 1965, so it has been at least this high before; the data does not cover earlier years.
Do active funds avoid S&P 500 concentration risk?
They can, because a manager may hold less of the largest companies. Picking one that does so and keeps beating the index has not been reliable. Of 164 US large-cap funds in the top quarter of their category at the end of 2021, 20.12% were still there a year later and none were there at every year-end from 2022 to 2025 (S&P Dow Jones Indices, U.S. Persistence Scorecard, Year-End 2025). In a second test in the same report, 13.84% of 159 top-quarter large-cap funds for 2015 to 2020 were in the top quarter again for 2020 to 2025. The SPIVA U.S. Scorecard, Year-End 2025, counts 85.59% of active large-cap funds trailing the S&P 500 over 10 years. Measured by assets instead of by fund, the average active large-cap dollar returned 18.03% in 2025 against 17.88% for the S&P 500, but trailed over 5, 10 and 20 years.
Does a total world index fund reduce concentration?
It cuts it by close to half. Calculated from published holdings on August 27, 2026, the 10 largest positions were 37.18% of a large US S&P 500 fund and 20.71% of a total world stock fund, a reduction of 44%. The 10 largest positions were still about a fifth of the world fund.
How can I check the concentration of my own index fund?
Look at the top-10 weight on the first page of the fund's fact sheet, and check whether it counts positions or companies (some companies have two share classes). Search the prospectus for 'non-diversified' to see whether the fund may hold more than the diversified limits allow. If you want less concentration, redirecting new contributions avoids the tax that selling a gain can trigger in many countries; have that checked for your own situation.