Why Are Interest Rates So High in 2026? What It Means for You
The 10-year Treasury hit its highest close since 2002 in October 2026. What's behind it, and what it means for your mortgage, savings and bonds.
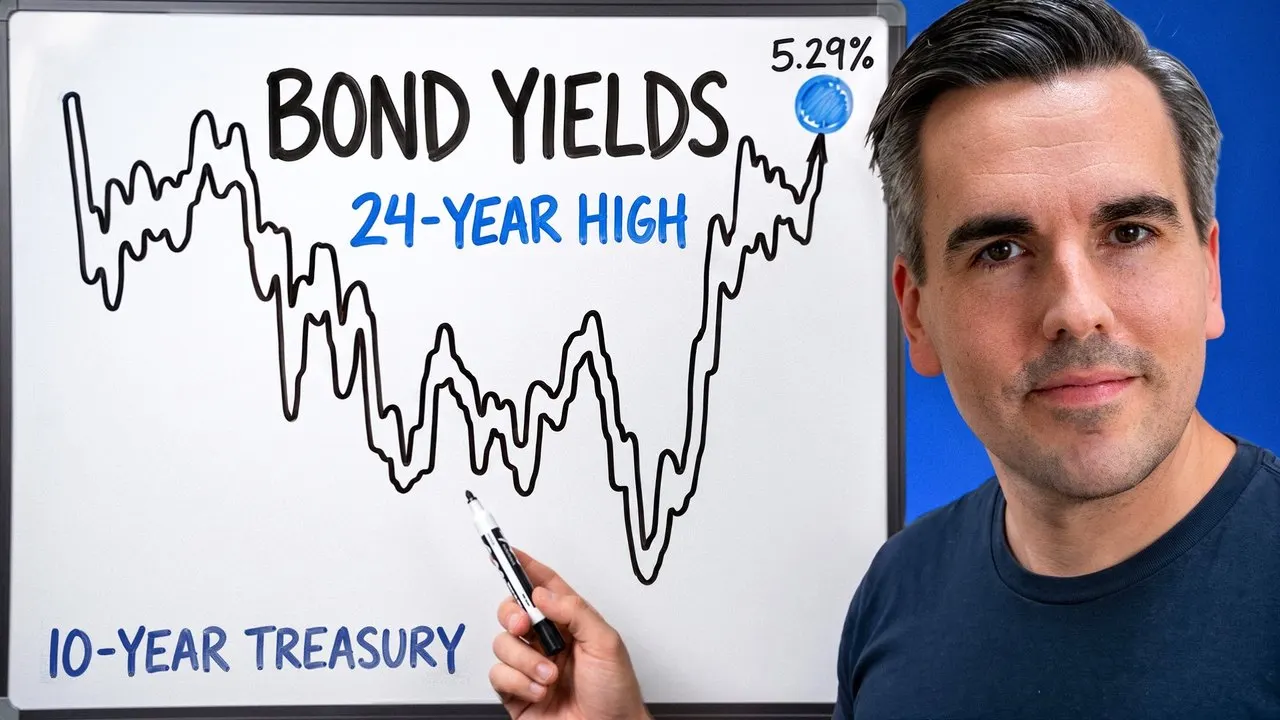
Why Are Interest Rates So High in 2026? Debt, Inflation or the Fed
Prefer to watch? This article is the written companion to the video above.
Video data as of October 2, 2026 · updated with data to October 19, 2026.
The video asks who did it: debt, inflation or the Fed. This page asks the question that comes straight after — what does it do to your mortgage, your savings and the bonds you already own? If you want every explanation tested in full, with both models, all the series and what would change each verdict, that lives in the research note Why US Bond Yields Rose in 2026: Six Explanations Tested. Here you get the short version of the who, and the long version of the what-now.
Which rate?
Three rates, three dates
The Fed's rate
3.75–4%
target range since September 16, 2026
Federal Reserve
The 10-year Treasury yield
5.15%
close on October 19, 2026
U.S. Treasury
The average 30-year fixed mortgage rate
7.40%
week of October 15, 2026
Freddie Mac
How high are interest rates, really? Higher than the 2010s, close to the 2000s
On September 30, 2026, the 10-year Treasury closed at 5.29%, then its highest close since May 2002. It went a little higher, to 5.31% on October 5, and closed at 5.15% on October 19.
10-year Treasury yield · January 2000 to September 2026
Far above the 2010s, close to the 2000s
Weekly closes of the 10-year Treasury yield. The dashed lines are the average of all daily closes in 2000–2007 and in 2010–2021, each continued faintly to the right edge so the latest close can be read against it.
At 5.29% on September 30, 2026, the 10-year Treasury yield is about 3 percentage points above its 2010–2021 average but only about half a point above its 2000–2007 average.
High against what, though? Against the average of 2010 to 2021, 2.20%, today’s yield is about 3 points higher. Against the average of 2000 to 2007, 4.71%, it is less than half a point higher. On October 2 that gap was 0.57 points; by October 19 it had shrunk below half a point. Adjusted for inflation the move looks the same: the inflation-protected 10-year Treasury paid 2.95% on top of inflation on October 5, the most since November 2008.
My reading, and it is the sentence from the video I would keep if I could keep only one: rates aren’t unusually high today. The 2010s were unusually low.
Is it inflation? Mostly not
If inflation were the driver, the part of the yield that pays for inflation would have done the rising. It didn’t. From the year’s low on February 27 (3.97%) to October 2 (5.28%), the 10-year yield rose 1.31 points, and 1.20 of them came from the real yield. The market’s charge for inflation added 0.11.
10-year Treasury yield · February 27 to October 2, 2026
Since February, the rise is almost all real yield
The 10-year yield from its 2026 low to October 2, 2026, split into the real yield and what the market charges for inflation (breakeven). Amber: the real yield.
Of the 1.31-point rise in the 10-year yield between February 27 and October 2, 2026, 1.20 points came from the real yield and only 0.11 from the inflation charge. The inflation charge is what the market asks for inflation over ten years, a market price rather than a forecast.
That charge stood at 2.36% on October 2, close to its 2003–2007 average of 2.34%. It is a market price, not a forecast. Through October 16, the last day the split was calculated for, the picture held — 1.02 of the 1.12 points were real.
Is it the Fed? Partly, and it depends how you count
On September 16, 2026, the Fed raised its target range by a quarter point, to 3.75–4%. And the short end of the curve led all year: from the end of 2025 to September 30, the 2-year yield rose 1.41 points, the 10-year 1.11.
2-year and 10-year Treasury yields · 2026
Short rates rose more than long rates in 2026
Two views with their own scales. Left: how far each yield rose, to September 30. Right: the gap between the 10-year and the 2-year yield, to October 2. Amber: the 2-year rise.
From December 31, 2025 to September 30, 2026 the 2-year yield rose 1.41 points and the 10-year 1.11 points, so the gap between them narrowed from 71 basis points to 45 by October 2.
How much of the 10-year’s rise is the Fed? Here the video and the research note seem to disagree. The video, with data to September 25, says between half and nearly all of the rise was the Fed’s expected rate. The note, with data to October 9, says the next two years of expected Fed policy explain about a fifth. Both are right. They count different things. Both Fed models, read on the same day, split the 1.01-point rise in their model 10-year yield from December 31, 2025 to October 2, 2026 like this:
| Part of the rise | Fed Board model (Kim-Wright) | New York Fed model (ACM) |
|---|---|---|
| Next two years of expected Fed policy | +0.18 (about a fifth) | +0.19 (about a fifth) |
| Expected short rates, years 2 to 10 | +0.32 | +0.65 |
| Term premium (the extra pay for lending long) | +0.51 | +0.17 |
There are two ways to count the Fed’s share. The next two years of expected Fed policy explain about a fifth of the 10-year’s rise since the end of 2025, in both Fed models. Count the whole expected path of short-term rates over ten years, and it’s about half in one model and about five-sixths in the other. Whether those later years reflect the Fed or a higher neutral rate, the data can’t separate.
Is it Washington’s debt? Mostly not for the 2026 jump
A lot of people blame Washington’s borrowing. That was my gut reaction too. The path is real: the Congressional Budget Office projects deficits of 5.6 to 6.7% of GDP in every year to 2036, and federal debt held by the public rising from 100.6% of GDP in fiscal 2026 to 120.2% in 2036.
What is missing is news. CBO published that projection in February, and as of October 16 there was no newer one. In the first eleven months of fiscal 2026, October to August, the deficit came in 0.4% smaller than a year earlier.
10-year Treasury yield · the old case and the new case
Debt would account for part of the old gap, almost none of the 2026 jump
10-year U.S. Treasury yield, percentage points. Amber: the part the debt rule of thumb would account for (solid up to the low estimate, hatched up to the high estimate).
On the research rule of thumb, Washington's borrowing would account for 0.46 to 1.21 points of the 3.08-point gap between the 10-year yield on October 2, 2026, and its 2010–2021 average, and about zero of the 1.31-point rise since February 27, 2026.
Source: U.S. Treasury Par Yield Curve (10-year, daily close; 2010–2021 average of all daily closes); CBO budget projections (February 2026 and earlier baselines) · as of October 2, 2026 · ProfitOwl calculation
Rule of thumb: 2 to 4 basis points per point of debt, two debt measures (actual debt +23 points, CBO debt five years ahead +30 points vs the 2010–2021 baselines). No new CBO baseline after February 2026 (checked to September 21, 2026).
Federal debt held by the public, CBO projections five years ahead; effect sizes from CBO (2024), Plante et al. (2025), Bhatt et al. (2026), estimated for five-year-forward rates and applied here to the 10-year yield; model estimates, not a forecast.
Put the research rules of thumb on CBO’s numbers and you get two different answers for two different questions. For the old case, the gap of 3.08 points to the 2010–2021 average on October 2, Washington’s borrowing would account for roughly 0.46 to 1.21 points. For the new case, the 1.31-point rise since February 27, it would account for about zero, because nothing in the projections changed. What exactly is being measured: federal debt held by the public, CBO projections five years ahead; effect sizes from CBO (2024), Plante et al. (2025), Bhatt et al. (2026), estimated for five-year-forward rates and applied here to the 10-year yield; model estimates, not a forecast.
In the video I called it half true: the debt can carry part of the gap to the zero-rate years, but not this year’s jump. The research note splits the same finding into two verdicts — doesn’t hold for the jump and can’t be settled for the level.
My take: money costs something again
This part is opinion. The usual story goes debt first, then higher rates. What I see in 2026 runs the other way: higher rates are making the debt more expensive. I’m not saying the debt is harmless. I’m saying it isn’t what moved this year.
What would prove me wrong is a budget law that adds a lot more debt, with yields jumping on that very day — the way British gilt yields did in September 2022. Nothing in 2026 looks like Britain’s version.
Is it just America? No
From the end of 2025 to September 30, 2026, 10-year yields rose in all six markets I checked, from 0.70 points in Germany to 1.11 in the US. Japan, with government debt of about twice its economy, rose 0.99, less than America. Debt lines up with some of the differences between countries, not with the common move. “It’s global” gets its own test in the research note.
10-year government bond yields in six countries · 2026
All six rose together; Japan, with debt about twice its GDP, rose less than the US
Left: how far the 10-year yield rose, largest first. Right: each country's government debt, same rows. Amber: Japan. The US, the comparison, has a stronger tone than the other four.
From the end of 2025 to September 30, 2026, 10-year yields rose in all six countries, from 0.70 points in Germany to 1.11 in the US. Japan, with debt of about twice its GDP, rose 0.99.
What it means for your mortgage
If your rate is already fixed, nothing changes for you. Rising yields don’t touch a fixed payment.
If you are about to borrow, the numbers moved a lot. Take a new $400,000 loan, 30 years fixed, principal and interest only:
| Freddie Mac average rate, 30-year fixed | Rate | Monthly payment |
|---|---|---|
| December 31, 2025 | 6.15% | $2,437 |
| October 1, 2026 (video) | 7.28% | $2,737 (about +$300) |
| October 15, 2026 (update) | 7.40% | $2,770 (about +$330) |
30-year fixed mortgage rate · January 2000 to October 2026
Mortgage rates rose from 6.15% to 7.28% by October 1, 2026
Weekly average rate on a 30-year fixed mortgage. The dots show the monthly payment on a $400,000 loan over 30 years, principal and interest only. The dashed line is the average weekly rate of 2000–2007, continued faintly to the right edge.
On a new $400,000 30-year fixed loan, the monthly payment at the October 1, 2026 average of 7.28% is $2,737, about $300 more than at the end of 2025 and $1,125 more than at the 2021 low. The rate itself peaked higher in October 2023, at 7.79%.
A rate you are quoted will not be exactly the average, so here is the same loan in quarter points. It is the plain annuity formula, not an offer from anyone:
| Rate | 6.00% | 6.25% | 6.50% | 6.75% | 7.00% | 7.25% | 7.50% | 7.75% |
|---|---|---|---|---|---|---|---|---|
| Monthly payment | $2,398 | $2,463 | $2,528 | $2,594 | $2,661 | $2,729 | $2,797 | $2,866 |
On a $400,000 loan, every quarter point is roughly $65 to $70 a month. That is the number to hold against your budget, more than any forecast.
Now the part most mortgage coverage leaves out. From the end of 2025 to October 1, almost all of the rise in mortgage rates matched the rise in the 10-year Treasury. After that, the 10-year eased but mortgage rates kept climbing: on October 15 the average 30-year rate was 2.30 points above the 10-year, the widest gap this year. From January to October 15, 2026, the gap averaged 1.97 points. I can’t tell you why it widened, and I’d be wary of anyone who says they can. It is not simply a bank’s profit margin, either: the gap also pays for the borrower’s right to repay early, for the difference in maturity, and for the spread that investors in mortgage bonds demand.
Three tools come up in every conversation with a lender. Each is mechanics, not a recommendation:
- A rate lock fixes the quoted rate for a set period while the loan is processed, usually for a fee or a slightly higher rate.
- A buydown means paying points upfront for a lower rate. It pays off only if you keep the loan long enough for the monthly saving to cover what you paid.
- Refinancing later makes sense on the same arithmetic: the costs of the new loan against the monthly saving, and how many months it takes to earn them back.
Ask a licensed lender for your own numbers. If you are still weighing whether to buy at all, the rent vs buy calculator puts both paths side by side with your figures. And for today’s average rather than mine: Freddie Mac publishes its survey every Thursday.
What it means for your savings
This is where higher rates work for you, at least on new money.
| Video (October 2, 2026) | Update | |
|---|---|---|
| 1-year Treasury bill (52 weeks) | 4.46% | 4.47% (October 19) |
| Average savings account (FDIC) | 0.37% (published September 21) | 0.38% (published October 19) |
| Average 12-month CD (FDIC) | 1.73% (published September 21) | 1.76% (published October 19) |
They’re not the same thing: the bill ties your money up for a year, the account doesn’t. After the last annual inflation rate of 3.40% (August 2026), the bill paid about +1.08% and the average savings account about −2.93% on October 2, before tax and assuming inflation stays where it was. The inflation calculator shows what that gap does over a few years.
Cash and Treasuries · what higher yields mean
New money earns more; longer bonds bought Dec 31, 2025 are worth less
Percent, before tax. After inflation assumes prices keep rising at the last annual rate, 3.40% a year. Bank rates are from September 21, 2026, Treasury rates from October 2, 2026.
On October 2, 2026, T-bills and the 10-year Treasury paid more than the last annual inflation rate of 3.40%, the average savings account far less; 10- and 30-year Treasuries bought at the end of 2025 showed losses in market value that do not apply if they are held to maturity.
If you rent and are saving for a down payment, the question is less which rate is highest than when you need the money. Money with a fixed date can sit somewhere that holds it until that date. Money without one needs to stay reachable. And whichever it is, look at what your own account pays. The average matters because most savings sit at the average rate. Check yours.
What it means for bonds you already own
When yields rise, older bonds lose value, because new ones pay more. A 10-year Treasury bought on the last day of 2025 was down about 4.6% by October 2, interest included, and about 3.5% by October 19. Hold it to the end and you get the full face value back.
A fund never matures. What decides what rising yields cost you is its duration, on the fund’s fact sheet: roughly how much its price moves when rates move by one point. If you might need the money at a bad moment, that number matters more than the yield. More on that in are bonds safe?
Will interest rates go down? What would change the picture
Nobody knows, and I won’t guess. What I can say: this year, mortgage rates moved with the 10-year Treasury, not with the Fed’s own rate, and since early October they rose even while the 10-year eased.
What I can also give you is a list of things that would change the picture, and when to look:
| If … | that points to … | When to look |
|---|---|---|
| the Fed signals a pause and long yields rise anyway | less Fed, more premium or long-run expectations | Fed meeting, October 27–28, 2026 |
| CBO publishes a much heavier debt projection and yields jump the same day | debt as a driver | no date set |
| the market’s inflation charge rises clearly above its 2003–2007 range | inflation as a driver | continuously |
| the gap between mortgage rates and the 10-year shrinks | mortgage rates falling faster than the 10-year | weekly, Freddie Mac survey |
How I checked
Every number on this page comes with its date, from the U.S. Treasury, the Fed, CBO, Freddie Mac, the FDIC and the BLS, and for the six-country chart from the IMF and each country’s central bank or finance ministry. The video’s numbers are never mixed with the update’s in one calculation. The charts keep the video’s data, each with its own end date. The methods, every series, both models and what the numbers can’t tell you are in the research note.
Keep going
Finished reading? Three places to go next
- Go deeper · researchWho paid for inflation? Research note: six claims about savers, borrowers, banks and the Fed, tested against public data.
- Try it with your numbersRent or buy? Run your own numbers Put in your rent and the price; official defaults cover the rest. The answer is in today’s money.
- On YouTubeSubscribe on YouTube (opens YouTube in a new tab)New videos every Tuesday: one money question per episode, checked against the data.
Primary sources (19)
- 01Daily Treasury Par Yield Curve Rates and Par Real Yield Curve Rates (2-, 10- and 30-year), daily close, to October 19, 2026; Daily Treasury Bill Rates (52-week, coupon equivalent) — U.S. Department of the Treasury
- 02FOMC statement, September 16, 2026 — target range for the federal funds rate raised by 1/4 point to 3-3/4 to 4 percent — Board of Governors of the Federal Reserve System
- 03Meeting calendars and information (next FOMC meeting October 27–28, 2026) — Board of Governors of the Federal Reserve System
- 04Yield curve models and data (Kim-Wright term premium, Gürkaynak-Sack-Wright curves) — Board of Governors of the Federal Reserve System
- 05Treasury term premia (ACM) — Federal Reserve Bank of New York
- 06Budget and economic data (10-year budget projections, February 2026; no newer projection as of October 16, 2026) — Congressional Budget Office
- 07Monthly Treasury Statement (federal deficit, October to August, fiscal year 2026) — U.S. Department of the Treasury, Bureau of the Fiscal Service
- 08The Effect of Government Debt on Interest Rates (Working Paper 2024-05) — Congressional Budget Office, 2024
- 09Revisiting the Interest Rate Effects of Federal Debt (Working Paper 2513) — Michael Plante, Alexander W. Richter and Sarah Zubairy, Federal Reserve Bank of Dallas, 2025
- 10Bhatt et al., Finance and Economics Discussion Series 2026-031 — Board of Governors of the Federal Reserve System, 2026
- 11Primary Mortgage Market Survey, 30-year fixed rate, weekly (to October 15, 2026) — Freddie Mac
- 12National rates and rate caps (savings and 12-month CD national averages, published September 21 and October 19, 2026) — Federal Deposit Insurance Corporation
- 13Consumer Price Index for All Urban Consumers, not seasonally adjusted (August 2026 over August 2025: 3.40%) — U.S. Bureau of Labor Statistics
- 14World Economic Outlook database, general government gross debt 2025 (retrieved October 5, 2026) — International Monetary Fund
- 15JGB interest rates (constant maturity) — Ministry of Finance Japan
- 16Statistical Interactive Database, 10-year nominal par yield (IUDMNPY) — Bank of England
- 17Government bond yields, 10-year (BPstat) — Banco de Portugal
- 18Secondary market for government debt, daily (table ti_1_3) — Banco de España
- 19Time series databases (yields on federal securities, Svensson curve) — Deutsche Bundesbank
Questions people actually ask
Why are interest rates so high in 2026?
Mostly because markets expect higher short-term rates for years ahead and want more to lend for ten years, a move shared with other large bond markets. From February 27 to October 2, 2026, the 10-year Treasury yield rose 1.31 percentage points, 1.20 of them in the real yield and only 0.11 in the market's charge for inflation (U.S. Treasury par yield curves). The Federal Reserve raised its target range to 3.75–4% on September 16, 2026, and the 2-year yield rose more than the 10-year this year. The Congressional Budget Office had published no new debt projection since February 2026 as of October 16, so the data don't show new borrowing plans behind the 2026 jump.
Why are mortgage rates so high right now?
The average 30-year fixed mortgage rate was 7.40% in the week of October 15, 2026, up from 6.15% at the end of 2025 (Freddie Mac Primary Mortgage Market Survey). Until early October almost all of that rise matched the rise in the 10-year Treasury yield. After that the 10-year eased while mortgage rates kept climbing, and on October 15 the average mortgage rate was 2.30 percentage points above the 10-year yield, the widest gap of 2026. On a new $400,000 30-year fixed loan, 7.40% means about $2,770 a month in principal and interest, about $330 more than at the end of 2025.
Does the national debt cause high interest rates?
Over the long run it can carry part of the level, but not this year's jump. On rules of thumb from the research (CBO 2024, Plante, Richter and Zubairy 2025, Bhatt et al. 2026), Washington's borrowing would account for roughly 0.46 to 1.21 of the 3.08-point gap between the 10-year Treasury yield on October 2, 2026 and its 2010–2021 average. For the 1.31-point rise from February 27 to October 2, 2026 it would account for about zero, because the Congressional Budget Office published no new debt projection after February 2026. CBO still projects federal deficits of 5.6–6.7% of GDP in every year to 2036. These are model estimates, not a forecast.
Will interest rates go down in 2026?
Nobody knows, and this answer makes no forecast. What the data show is that in 2026 US mortgage rates moved with the 10-year Treasury yield rather than with the Federal Reserve's own rate, and that from early October they rose even while the 10-year yield eased (Freddie Mac, U.S. Treasury). The Fed's next meeting is on October 27–28, 2026. Long yields rising even if the Fed signals a pause, a much heavier debt projection from the Congressional Budget Office with yields jumping the same day, or the market's inflation charge rising clearly above its 2003–2007 range would each change the picture.
Are interest rates higher than in 2007?
Partly, depending on the day. The 10-year Treasury yield's highest close in 2007 was 5.26% on June 12, 2007. It closed above that at 5.29% on September 30, 2026 and at 5.31% on October 5, 2026, the highest close since May 2002, and below it at 5.15% on October 19, 2026 (U.S. Treasury par yield curve, daily close).
How much does a quarter point add to a mortgage payment?
On a $400,000 30-year fixed loan, each quarter point between 6% and 7.75% adds roughly $65 to $70 a month in principal and interest: about $2,398 a month at 6.00%, $2,661 at 7.00% and $2,866 at 7.75%. These are results of the standard annuity formula, before taxes, insurance and fees, and not a lender's offer.