Research note
Who Paid for Inflation? Savers, Borrowers, Banks and Government
With US inflation at 3.4 percent in August 2026: who paid for the last round, and who gained? Six claims about savers, borrowers, banks and the Fed, tested.
By Philipp Misura · ProfitOwl Research · data as of October 12, 2026 · version 1.0
In August 2026, US consumer prices were 3.4 percent higher than a year earlier, and in September the Fed raised rates for the first time since 2023. That brings back the question from 2022: when prices rise faster than interest rates, who pays? The last round can now be followed over five years. In 2025, money in the average savings account still lost 2.3 percent of its buying power, as it had in every year since 2010. The federal government, which gained most in 2022, was paying a positive real rate again: plus 0.7 percent.
The 2022 round shows how it works. Consumer prices were 8 percent higher on average than in 2021. The money didn’t vanish. It moved: from people who are owed fixed dollar amounts to people who owe them. The average savings account lost 7.3 percent of its buying power that year. For a household with a 30-year mortgage taken out in 2021, the loan’s real cost was minus 4.7 percent. Same household, same inflation, opposite sides. We tested six common claims about who paid and who gained, against public data from 2021 to 2025. The short answer: the government gained, then stopped. Borrowers gained if they had signed at the right time. Money in the bank lost every year.
The short version
| # | What people say | Verdict (as of October 12, 2026) |
|---|---|---|
| 1 | “Inflation is a tax on savers” | Holds for money in bank accounts, every year from 2021 to 2025; not for Treasury bills after tax since 2024 |
| 2 | “Governments inflated their debt away” | Half true: a dent in 2022 and 2023, not a write-off, and over since 2024 |
| 3 | “Borrowers won” | Half true: fixed-rate borrowers who signed before 2022 did; later ones didn’t |
| 4 | “Banks pocketed the rate hikes” | Half true: a large gap on savings accounts, but no higher profit per dollar |
| 5 | “The central bank made money on it” | Doesn’t hold for 2023 to 2025 |
| 6 | “Washington will just inflate its way out again” | Can’t be settled |
Most of these claims aren’t wrong. They are undated. Each one fits some years and fails in others. This note puts a date on each.
Quote us on
- In 2025, the average US savings account lost 2.3 percent of its buying power, as in every year since 2010; the federal government paid a positive real rate on its debt for the second year running, plus 0.7 percent.
- A 30-year fixed mortgage signed in 2021 at 2.96 percent gained from inflation until 2023; by 2025 its real cost had risen just above zero, plus 0.2 percent.
- From 2022 to 2025, the interest rate the Fed pays on bank reserves was on average 3.7 percentage points above the average savings account rate; from 2015 to 2021, 0.85 points.
- In 2022 and 2023, inflation reduced the real value of US federal debt held by the public by more than 1.5 trillion dollars. In 2024 and 2025, that gain was gone.
Only the surprise moves money
Inflation that everyone expects is priced into interest rates. In 2021, the bond market priced inflation of about 2.4 percent a year over the following ten years. In 2022, prices rose 8 percent. That gap is what moved money from lenders to borrowers. Everyone holding a fixed claim lost, and everyone owing one gained. The length of the contract decided for how long.
The ledger: who was on which side
The table shows the real interest rate on six contracts, year by year: the rate after inflation. Read every row from the holder’s side. For a lender, a negative real rate is a loss. For a borrower, a negative real rate is a gain.
| Contract, real rate in percent, before tax | Side | 2021 | 2022 | 2023 | 2024 | 2025 |
|---|---|---|---|---|---|---|
| Savings account, national average rate | lender | −4.4 | −7.3 | −3.6 | −2.4 | −2.3 |
| All US bank deposits, average rate actually paid | lender | −4.4 | −7.0 | −2.2 | −0.6 | −0.7 |
| 3-month Treasury bill | lender | −4.4 | −5.5 | +0.9 | +2.0 | +1.3 |
| 30-year fixed mortgage signed in 2021 (2.96%) | borrower | −1.7 | −4.7 | −1.1 | 0.0 | +0.2 |
| 30-year fixed mortgage signed in 2023 (6.81%) | borrower | +2.6 | +3.8 | +4.0 | ||
| Federal debt held by the public | borrower | −2.7 | −5.4 | −1.3 | +0.4 | +0.7 |
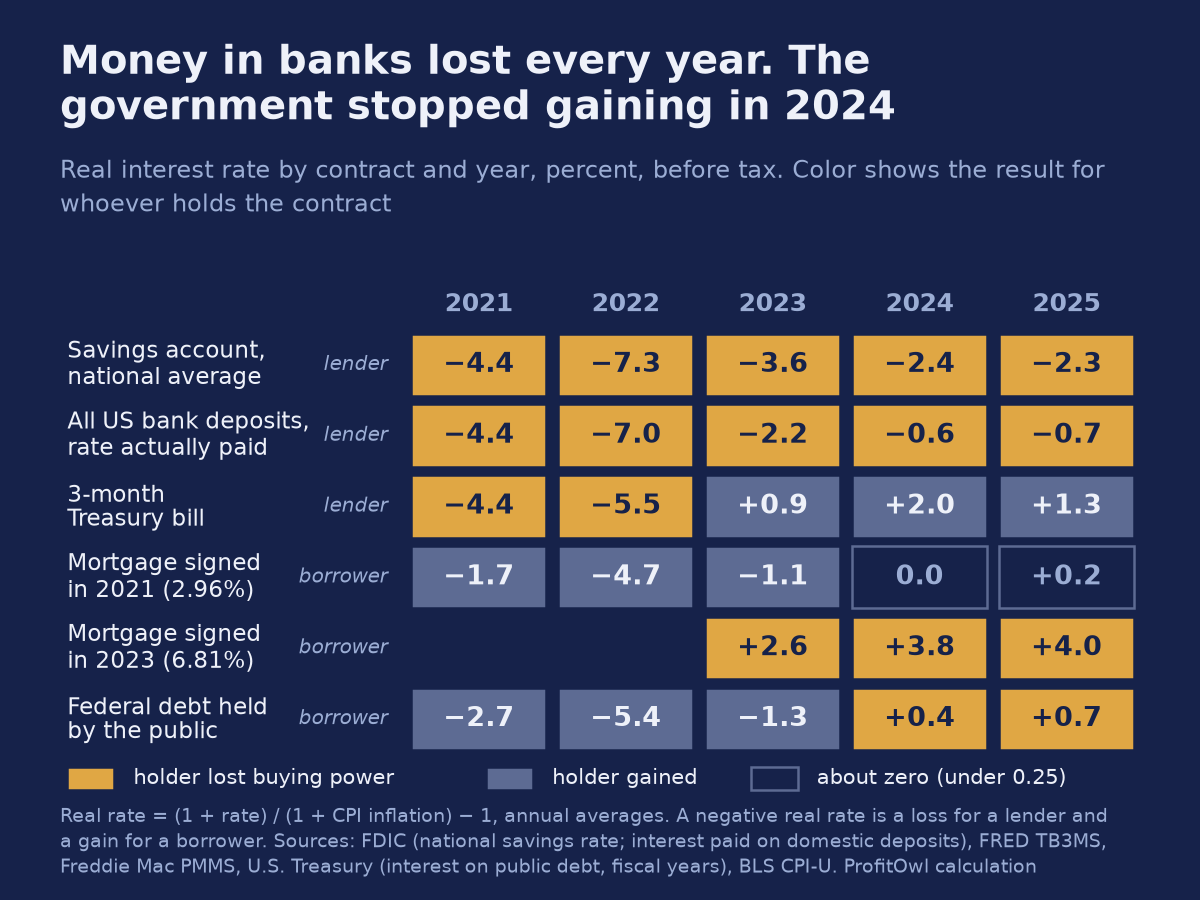
In 2022, every lender lost, whatever it held. From 2023, a Treasury bill paid more than inflation; money in banks still didn’t. In 2024, the federal government and the 2021 borrower stopped gaining in the same year.
The six claims below take these rows one at a time: savers (claim 1), the government (2), mortgage borrowers (3), the banks in between (4), and the Fed, which stood behind all of them (5).
1 · “Inflation is a tax on savers”
Verdict: Holds for money in banks
The claim at its best. Inflation shrinks money that sits still. Nobody votes on it, nobody sends a bill, and the account statement never shows it.
The data. A hundred dollars put into the average US savings account in May 2009 shows about 103 dollars on the statement in August 2026, and buys what 65.66 dollars bought then. In 196 of those 208 months, the account paid less than inflation; the last month it paid more was September 2015. Tax barely matters here: at a 22 percent federal rate, the hundred dollars buy 65.25 instead of 65.66, because there was hardly any interest to tax.
The national average savings rate is a posted rate, and many people earned more. So we also measured what US banks actually paid across all domestic deposits, business accounts and time deposits included. That rate was below inflation every year from 2021 to 2025, too, though only just in 2024 and 2025: minus 0.6 and minus 0.7 percent in real terms.
Short-term money outside banks did better. Month by month from January 2023 to December 2025, the 3-month Treasury bill turned 100 dollars into 105.43 in buying power before tax; the savings account turned them into 92.75. After a 22 percent federal tax, the bill beat inflation from 2024 on, not in 2023. We use the Treasury bill as the market price of short-term money, not as a recommendation.
Two kinds of lenders sat at the extremes. Holders of inflation-protected Treasuries (TIPS) were compensated: in the fiscal year 2022, the Treasury paid them 143 billion dollars for inflation, 29 percent of its interest on public debt that year. Cash, at the other end, pays nothing. The 2.27 trillion dollars of US currency in circulation in 2022 lost about 168 billion dollars of buying power that year. How much of that cash US households held, and how much sat abroad, we can’t say.
Verdict: Holds for money in bank accounts, every year from 2021 to 2025. Doesn’t hold for Treasury bills after tax since 2024.
Strongest objection. Nobody keeps all their wealth in a savings account, and part of the loss is the price of having cash at hand. True. The finding applies to the money that sits there, not to a household’s whole wealth. At the end of 2021, deposits and cash were 12.8 percent of US households’ financial assets; at the end of June 2026, 9.7 percent. Money market funds rose from 2.3 to 3.5 percent over the same period.
2 · “Governments inflated their debt away”
Verdict: Half true
The claim at its best. Governments with large debts gain from inflation: prices and tax revenue rise, the debt doesn’t. After World War II, this is how the US and Britain shrank their war debts.
The data. In 2022 and 2023, US inflation ran well above the interest rate the federal government paid on its existing debt. The real value of its debt held by the public fell by an amount equal to 5.45 percent of the previous year’s GDP in 2022 and 1.27 percent in 2023. In dollars, that is more than 1.5 trillion over the two years. Against 23.2 trillion dollars of debt held by the public at the end of 2021, that is a dent of less than a tenth, not a write-off.
Carmen Reinhart and Belen Sbrancia found that the US and Britain liquidated 3 to 4 percent of GDP a year from 1945 to 1980. They measured differently, so only the order of magnitude compares. The US exceeded that size in 2022 alone, and it was over after two years, not decades.
The debt ratio shows the same thing from another side. From 2022 to 2025, deficits before interest added 11.5 points to US federal debt as a share of GDP. Nominal growth running ahead of the interest rate took 13.2 points off, and about two thirds of that growth was inflation. In the euro area, measured as general government debt, deficits added 5.7 points and the same effect took off 12.4. In the US, Germany, France, Italy and Spain alike, the budget made the debt bigger and inflation made it smaller.
Not all of the debt was exposed. The Treasury’s interest bill counts the inflation adjustment on TIPS as interest, 143 billion dollars in the fiscal year 2022. That protection is already inside the government’s real rate in the ledger, and it made the gain smaller.
Then it stopped. In 2024, the federal government’s real interest rate on its existing debt turned positive, plus 0.4 percent, and in 2025 it was plus 0.7 percent. The relief turned into a small cost: 0.43 percent of the previous year’s GDP in 2024 and 0.70 percent in 2025. Growth still helps: nominal GDP grew faster than the interest rate in both years, and that took 1.74 and 1.43 points off the debt ratio. But that is growth, not a negative real rate.
Before we had the numbers, we set a test: if the government’s real rate stayed positive for two years, on new borrowing and on the existing debt, the windfall was over. The US met that test with 2024 and 2025. The euro area has met it for one year so far.
One more caveat: at the end of 2021, the Fed held 26.5 percent of the debt in public hands. Seen as one government, Treasury and Fed together, part of the gain came back as the Fed’s losses (claim 5).
Verdict: Half true. It held in 2022 and 2023, as a dent. It doesn’t hold in the present tense.
Strongest objection. The inflation of 2022 came from energy prices and supply chains, not from a plan to shrink the debt. We agree, and we don’t claim intent. A plan wouldn’t have ended by itself after two years. This one did, as soon as the short-term debt was refinanced at higher rates.
3 · “Borrowers won”
Verdict: Half true
The claim at its best. If you owe a fixed amount, inflation pays part of your debt for you. Homeowners with cheap mortgages came out ahead.
The data. In 2021, the average 30-year fixed mortgage rate was 2.96 percent, the lowest annual average since the survey began in 1971. In 2022, that mortgage’s real cost was minus 4.7 percent; for federal debt it was minus 5.4 percent. A household that signed in 2021 held the same kind of contract as the Treasury, only longer.
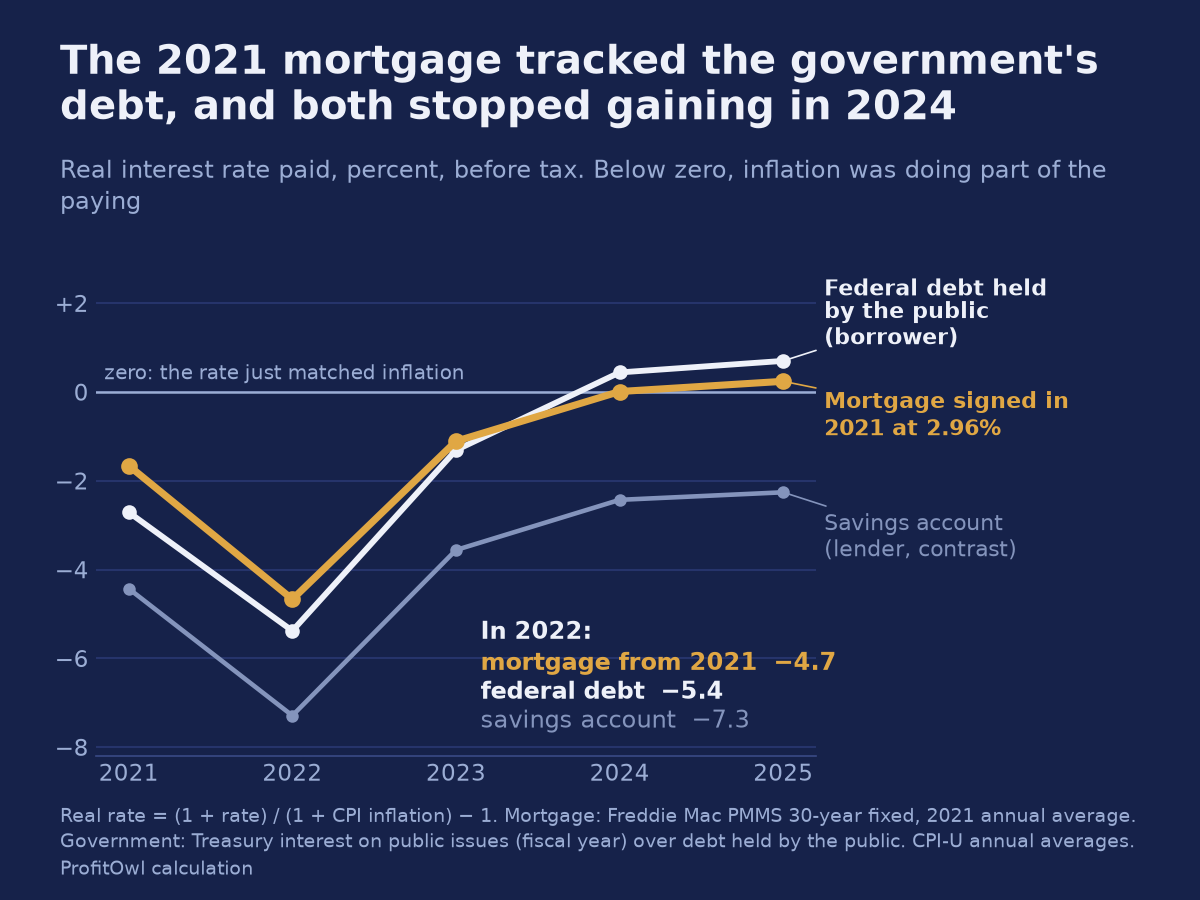
The gain ended in 2024, the same year as the government’s. In 2025, the 2021 mortgage cost 0.2 percent above inflation. A mortgage signed in 2023 at 6.81 percent cost about 4 percent above inflation in 2025. And for someone who bought in 2025, the monthly payment on the same house took 78 percent more hours of work than in 2015, or 68 percent more of the median household’s income.
The difference between the 2021 borrower and the 2025 buyer isn’t skill. It’s a date.
Why the length of the contract decides. A 30-year fixed mortgage never resets; its holder keeps the 2021 rate for as long as the loan runs. Federal debt resets much faster. On July 31, 2026, a third of the marketable federal debt was due within twelve months, and its average remaining life was 5.84 years. That is why the government’s gain ended: new debt replaced old debt at higher rates. Its implicit interest rate, interest paid over debt held by the public, rose from 2.20 percent in 2022 to 3.41 percent in 2024.
This applies to fixed rates. Credit cards are the opposite case. The average credit card rate was 16.3 percent in 2022, 7.6 points above inflation, and 21.6 percent in 2024, 18.1 points above. Credit card borrowers didn’t gain in any year.
Borrowers also earn wages. Average hourly earnings fell 2.4 percent in real terms in 2022. By 2025 they had caught up and were back at their 2021 level in buying power, plus 0.1 percent. For many households, the gain on a fixed mortgage in 2022 came alongside a real pay cut.
Verdict: Half true. Fixed-rate borrowers who signed in 2019 to 2021 gained in 2022 and 2023. The 2023 borrower pays well above inflation, and credit card borrowers never gained.
Strongest objection. The 2021 borrower also paid a high price for the house: measured in hourly wages, house prices were 23 percent higher in 2021 than in 2015. The gain on the loan doesn’t tell you whether the purchase was good.
4 · “Banks pocketed the rate hikes”
Verdict: Half true
The claim at its best. The Fed raised rates, banks earned more on their reserves, and savers got almost nothing. The difference went to the banks.
The data. The Fed pays banks interest on the reserves they hold with it. That is the rate a bank can earn on a riskless overnight dollar, so we use it as the benchmark. Banks earn it only on their reserves, not on every deposit: in 2025, reserves averaged about 3.2 trillion dollars, against 18.4 trillion of domestic deposits at the end of the year. From 2022 to 2025, it was on average 3.7 percentage points above the average savings account rate, with a peak of 4.97 points in August 2023. In September 2026, the gap was 3.39 points.
It isn’t new. From 2015 to 2021, the gap was already 0.85 points: the Fed’s rate averaged 0.91 percent, the savings account paid 0.07. In Germany, by contrast, the comparable gap, the ECB’s deposit rate minus the average overnight deposit rate, was negative in those years.
Against a 10-year Treasury, the picture is similar. From 2009 to 2014, a 10-year Treasury paid 2.73 points more than the savings account after tax, and 2.58 of that was the price of tying money up for ten years. From 2022 to 2025, the gap was 3.61 points, and all of it came from the bank’s side. In those years, though, the Fed’s overnight rate was on average slightly above the 10-year yield, so the split says as much about the shape of the yield curve as about the banks.
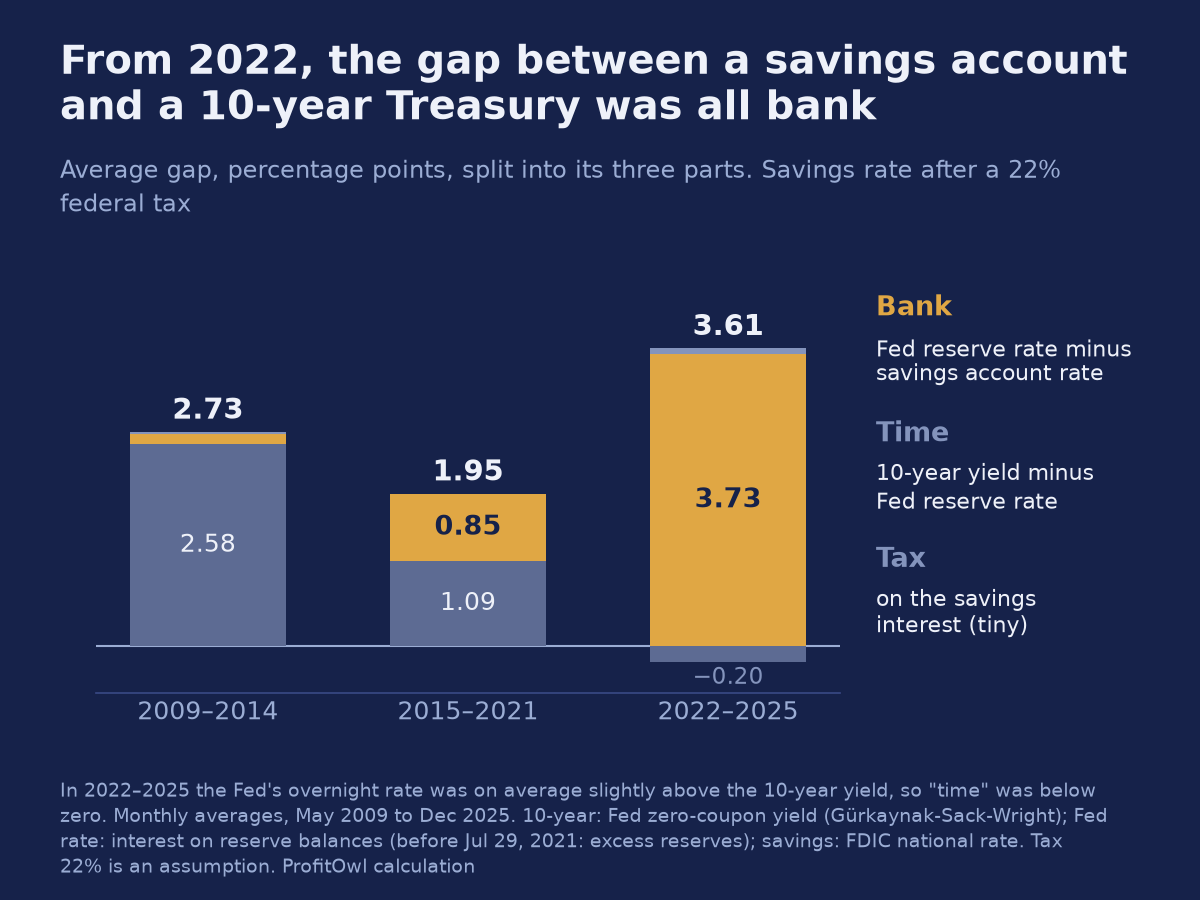
On all deposits, banks paid much more than on the average savings account. Their interest on domestic deposits rose from 24 billion dollars in 2021 to a peak of 411 billion in 2024, and was 368 billion in 2025. Across all deposits, business accounts and time deposits included, that is about 2.3 percent in 2024, against an average savings account rate of 0.45 percent. At the same time, from the end of 2021 to August 2026, retail money market funds grew from 1.36 trillion dollars to 3.03 trillion. The two series move together; they don’t show that the money moved from one to the other.
Banks also lost on the other side of their balance sheet. Rising rates cut the market value of the bonds they held: at the end of September 2023, their unrealized losses on securities were 684 billion dollars.
The result: banks’ profit after all costs was 1.25 cents per dollar of assets in 2019, 1.11 cents in 2022, 1.07 in 2023, 1.11 in 2024 and 1.17 in 2025. No year since the rate hikes reached 2019.
Verdict: Half true. On the average savings account, banks kept a large gap, as they had before 2022. They didn’t become more profitable per dollar than before the pandemic.
Strongest objection. The gap is not a profit. Deposit insurance, liquidity rules and the whole lending side are missing from it. That is why we measured profit separately.
5 · “The central bank made money on it”
Verdict: Doesn’t hold for 2023 to 2025
The claim at its best. The Fed holds trillions in bonds, earns interest on them and hands its profit to the Treasury. When rates rise, it earns more.
The data. The Fed stood on the other side of the 2021 mortgage. It holds long-term bonds that pay fixed rates, and it funds them with bank reserves on which it pays a rate that moves with its policy rate. When it raised rates, its costs rose and its income didn’t.
In the calendar years 2023 to 2025, the Fed earned 471 billion dollars of interest on its Treasury and mortgage securities. It paid 675 billion: about 511 billion on deposits, mostly banks’ reserves, 112 billion in its reverse repo facility, mostly to money market funds, and 52 billion to foreign central banks and other official accounts. Its net interest result over the three years was minus 187 billion dollars.
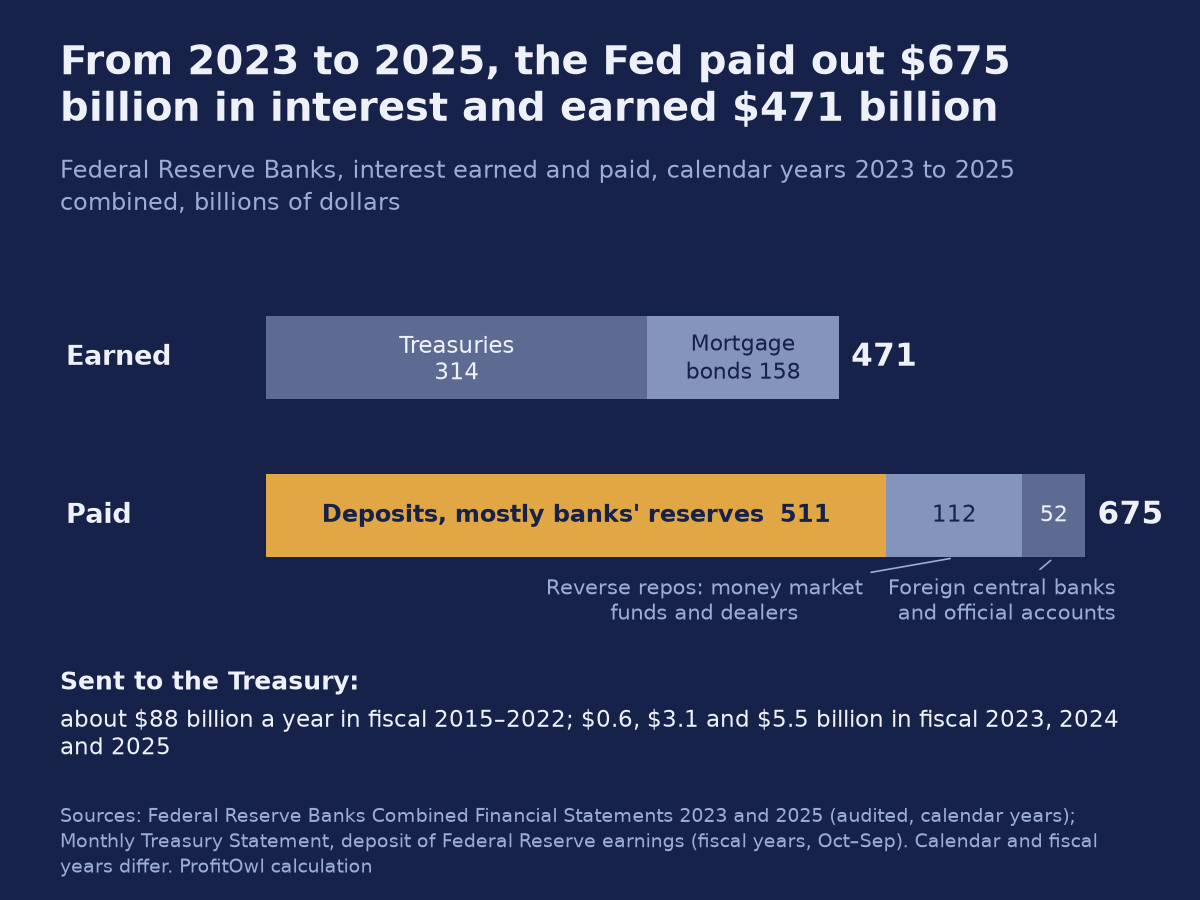
That shows up at the Treasury. In the fiscal years 2015 to 2022, the Fed sent the Treasury 88 billion dollars a year on average; in the fiscal years 2023 to 2025, 0.6, 3.1 and 5.5 billion. At the end of 2025, it had a shortfall of 243 billion dollars to earn back before payments resume in full. Over the full cycle it is still ahead: in the decade and a half before 2025, it had sent the Treasury more than 1 trillion dollars.
Germany’s central bank shows the same pattern, earlier. The Bundesbank paid nothing to the federal government for its financial years 2020 to 2025: first it held profits back as a cushion against this risk, then it used the cushion to cover losses from 2022 on. 2020 was the first year without a payment since 1979.
Verdict: Doesn’t hold for 2023 to 2025. Part of what the Treasury gained on its debt (claim 2), it lost through its central bank.
Strongest objection. A central bank can’t go bankrupt, and the shortfall is a bookkeeping item. Correct. We don’t say the Fed is in trouble. We say that in those years, the interest went to banks, money market funds and foreign official accounts, and the Treasury lost the payments it used to receive.
6 · “Washington will just inflate its way out again”
Verdict: Can’t be settled
The claim at its best. It worked in 2022, so it will work again. Debt is high, and inflation is the easiest way out.
The data. It only works while inflation runs above the rate the debt pays, and US federal debt resets fast: a third within a year. A second round would also be expected sooner. Lenders who were surprised once price inflation faster the next time, and that limits how much can be moved.
Who would bear it has changed. At the end of 2021, the Fed held 26.5 percent of the debt in public hands; at the end of March 2026, 14.9 percent. Foreign investors, central banks included, held 29.7 percent. The rest, 55.3 percent, sat with domestic holders: funds, banks, pension funds, insurers, households, states and cities. A second round would hit every holder of fixed-rate debt, and today more than half of them are at home.
Verdict: Can’t be settled. It depends on future inflation and on how the debt is financed. We don’t predict either, and we don’t give a date.
What we think
This is the only part of the note that is opinion.
The inflation of 2022 wasn’t theft, and it wasn’t a plan. It was a surprise, and the surprise moved money along existing contracts. Whoever held a fixed claim lost, whoever owed one gained, and the length of the contract decided for how long. The government’s real rate was already negative in 2021; the big gain came in 2022 and 2023 and ended in 2024, because its debt is short. The 2021 homeowner gained in the same years and keeps a low rate for decades. Money in banks lost every year: the average savings rate rose only from 0.06 percent in 2021 to 0.45 percent in 2024, while a Treasury bill paid about 5 percent in 2023 and 2024.
For a household, the useful question isn’t whether inflation is good or bad. It is: which of my contracts are fixed, for how long, and does my cash earn a market rate or the rate my bank posts?
None of this is investment advice. It is a dated reading of public data.
Data and methods in detail
Real rates. Real rate = (1 + nominal rate) / (1 + inflation) − 1, with the annual average of each rate against the annual average of the consumer price index (CPI-U). All rates before tax unless stated. The subtraction shortcut overstates losses when inflation is high: in 2022 it would give minus 7.9 instead of minus 7.3 for the savings account.
Expected inflation. 10-year breakeven inflation from the Federal Reserve’s zero-coupon nominal and TIPS curves (Gürkaynak, Sack and Wright), 2021 average.
Savings account. FDIC National Rate for savings accounts, monthly. In April 2021, the FDIC changed from a branch-weighted to a deposit-weighted average; the two methods never ran side by side. All deposits: FDIC aggregate data for all insured institutions, interest expense on domestic deposits divided by domestic deposits at year end.
Treasury bill. 3-month Treasury bill, secondary market, discount basis (FRED TB3MS); annual average in the ledger, monthly path for the 2023-to-2025 comparison. Tax: 22 percent federal rate, an assumption; Treasury bills are exempt from state tax.
Mortgages. Freddie Mac Primary Mortgage Market Survey, 30-year fixed, annual average of weekly rates; new loans, conforming, no points. The survey changed method in November 2022.
Government. Treasury interest on marketable debt in the fiscal year, divided by debt held by the public at the end of the previous year (implicit rate), against calendar-year CPI-U. Liquidation as a share of the previous year’s GDP. Debt-ratio decomposition: change in the ratio = interest-growth effect − primary balance + other items; the other items are a residual and include a gap of about 0.2 trillion dollars a year between federal and national-accounts interest data. Euro area: Eurostat, general government, Maastricht debt; with the GDP deflator instead of consumer prices, its liquidation from 2022 to 2024 is 2.35 instead of 3.06 percent of GDP a year. Consumer prices measure what lenders lost, the deflator what the government gained on its debt ratio. The 2021 column spans the FDIC method change and the Fed’s switch from the excess-reserve rate to the reserve-balance rate in July 2021.
Reserve rate and gaps. Fed interest rate on reserve balances (before July 29, 2021, on excess reserves) minus the FDIC savings rate. The 10-year comparison splits the distance between a 10-year Treasury and the after-tax savings rate into time (10-year yield minus Fed rate), bank (Fed rate minus savings rate) and tax. We ran it with the Fed’s 10-year and 6-year zero-coupon yields and checked it against the Treasury par curve; the conclusion is the same.
Banks. FDIC aggregate data, net income and total assets, annual; FDIC Quarterly Banking Profile for unrealized securities losses. Money market funds: Fed H.6, retail share classes; bank deposits: Fed H.8, commercial banks.
Federal Reserve. Federal Reserve Banks Combined Financial Statements 2023 and 2025, audited, calendar years; Monthly Treasury Statement for remittances by fiscal year; H.4.1 for the shortfall (deferred asset); Monetary Policy Report, February 2025, for cumulative remittances. Bundesbank annual accounts.
Holders of the debt. Debt held by the public, by foreign and international investors and by Federal Reserve Banks, end of quarter (FRED FYGFDPUN, FDHBFIN, FDHBFRBN). Shares of holdings, not of interest received. Maturity of marketable debt computed from 462 individual securities.
TIPS, cash, credit cards, reserves, wages, household wealth. Treasury Fiscal Data, interest expense on public issues by type, fiscal years; Fed currency in circulation (FRED MBCURRCIR), annual average, loss of buying power = currency × (1 − 1/(1 + inflation)); commercial bank interest rate on credit card plans, all accounts (FRED TERMCBCCALLNS); reserve balances with Federal Reserve Banks, weekly average (FRED WRESBAL); BLS average hourly earnings against CPI-U; Fed Financial Accounts (Z.1) for households and nonprofits: checkable deposits and currency, time and savings deposits, money market fund shares, total financial assets.
House prices. Shiller home price index, BLS average hourly earnings, Census median household income, Freddie Mac 30-year rate; same house, 80 percent loan, 30-year annuity, index 2015 = 100.
Checks. Every number in this note is tied to a line in our source register and checked against the underlying table by a script before publication. The register and the scripts are not published with this note.
Don’t quote us on
- “The US government is inflating its debt away.” It did in 2022 and 2023, not in 2024 and 2025.
- “Savers lost X dollars and borrowers gained X dollars.” The transfer between households depends on how large each account and loan is; we have no source for that.
- “Banks made record profits because of high rates.” Per dollar of assets, no year since 2022 reached 2019.
- “Financial repression.” That implies intent and a constraint. What we measured was a windfall on old debt that ended by itself.
- “The Fed’s losses don’t matter.” They don’t threaten the Fed, but they cost the Treasury the payments it used to receive.
- A date for the next round. We don’t make one.
Changelog
- 1.0 (October 2026): first version, data as of October 12, 2026.
Related
- Project page: Rates, Debt and Inflation: Testing What Everyone Says
- Why US bond yields rose in 2026: Six explanations tested
How to cite this
Misura, Philipp (2026). "Who Paid for Inflation? Savers, Borrowers, Banks and Government." Research note, Rates, Debt and Inflation: Testing What Everyone Says, ProfitOwl Research, version 1.0, data as of October 12, 2026. https://profit-owl.com/research/rates-debt-inflation-claims/who-paid-for-inflation
Text and charts: CC BY 4.0 (opens in new tab). The underlying data belong to their publishers and remain under their terms; this licence does not cover them.
Primary sources
- 01National rates and rate caps (savings, monthly) — Federal Deposit Insurance Corporation
- 02Primary Mortgage Market Survey (30-year fixed) — Freddie Mac
- 03Interest Expense on the Public Debt Outstanding — U.S. Department of the Treasury, Bureau of the Fiscal Service
- 04Monthly Treasury Statement — U.S. Department of the Treasury, Bureau of the Fiscal Service
- 05Federal Reserve Banks Combined Financial Statements 2025 and 2024 — Board of Governors of the Federal Reserve System
- 06Federal Reserve Banks Combined Financial Statements 2023 and 2022 — Board of Governors of the Federal Reserve System
- 07Monetary Policy Report, February 2025, part 2 — Board of Governors of the Federal Reserve System
- 08Quarterly Banking Profile, third quarter 2023 — Federal Deposit Insurance Corporation
- 093-Month Treasury Bill Secondary Market Rate (TB3MS) — Federal Reserve Bank of St. Louis / Board of Governors
- 10Federal Debt Held by the Public; by Foreign and International Investors; by Federal Reserve Banks — Federal Reserve Bank of St. Louis / U.S. Treasury
- 11Commercial Bank Interest Rate on Credit Card Plans, All Accounts — Federal Reserve Bank of St. Louis / Board of Governors
- 12Financial Accounts of the United States (Z.1) — Board of Governors of the Federal Reserve System
- 13Yield curve models and data (Gürkaynak-Sack-Wright) — Board of Governors of the Federal Reserve System
- 14Home price index and stock market data (Robert J. Shiller) — Yale University
- 15Reinhart and Sbrancia, The liquidation of government debt, Economic Policy 30(82), 2015 — Oxford University Press
Written by Philipp Misura, who is not a researcher by profession — see about. Corrections go on this page, marked and dated, rather than being made quietly.