Research note
Why US Bond Yields Rose in 2026: Six Explanations Tested
Six explanations for the 2026 rise in US Treasury yields, tested against public data: inflation, the Fed, debt, term premium, a global move and AI.
By Philipp Misura · ProfitOwl Research · data as of October 9, 2026 · version 1.0
On October 5, 2026, the 10-year Treasury yield closed at 5.31 percent, its highest close since May 2002. The usual suspects are Washington’s debt, inflation and the Fed. We tested six explanations against public data. Almost all of the 1.27-point rise since the February 27 low came from the real yield, what Treasuries pay above inflation. The Fed’s expected path for the next two years explains only about a fifth of it, and debt explains almost none of the 2026 jump.
The short version
| # | What people say | Verdict (as of October 9, 2026) |
|---|---|---|
| 1 | “Yields rose because inflation is back” | Doesn’t hold for the 2026 rise |
| 2 | “The Fed did it” | Half true: it led the short end, not most of the 10-year |
| 3 | “Rates are high because Washington borrows too much” | Doesn’t hold for the 2026 jump; can’t be settled for the level |
| 4 | “Investors demand a bigger premium” | Half true: both Fed models show a higher premium, but disagree on its size |
| 5 | “It’s global” | Holds |
| 6 | “AI is soaking up capital and pushing up rates” | Can’t be settled yet |
Most of these claims aren’t wrong. They are undated. Each one fits some window and fails in another. This note puts a date on each.
Quote us on
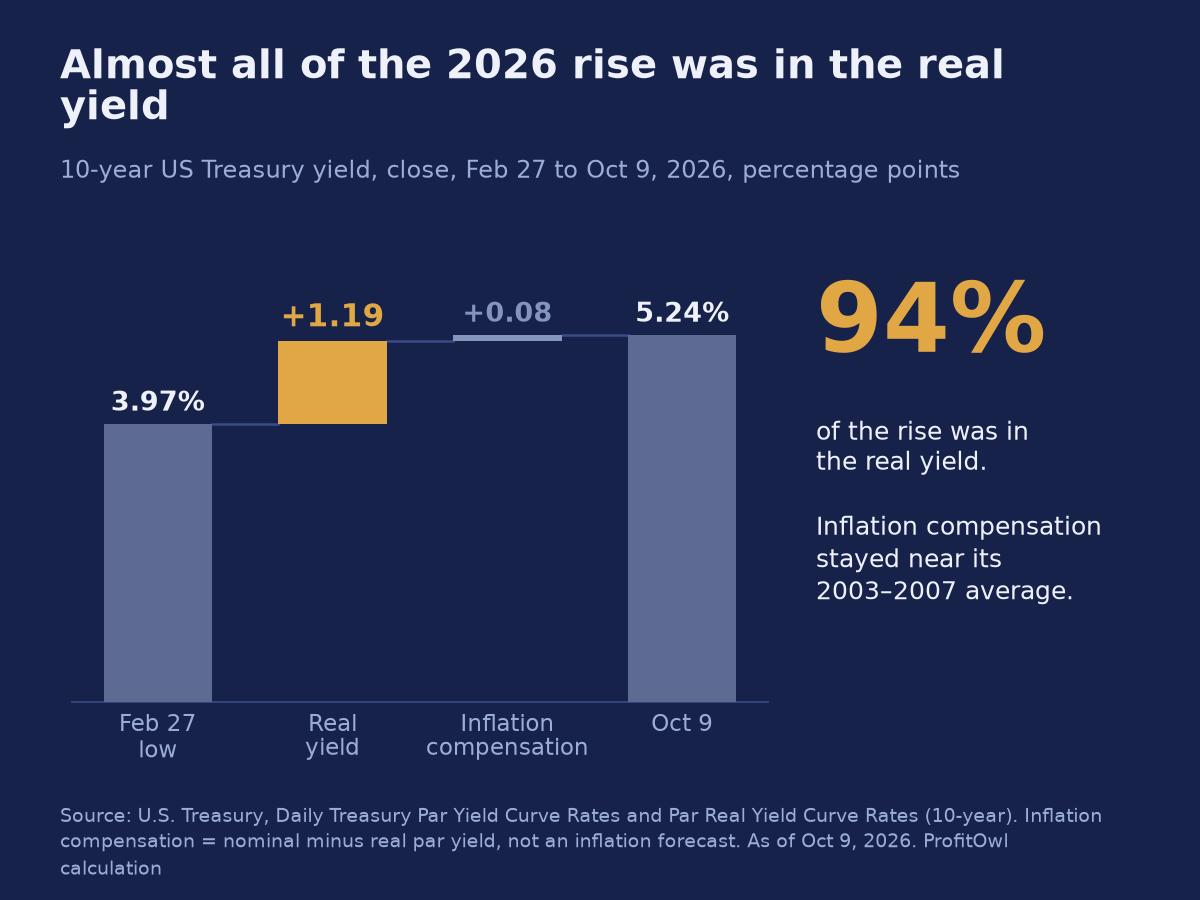
- From its February 27 low to October 9, 2026, the 10-year Treasury yield rose 1.27 percentage points: 1.19 from the real yield and 0.08 from inflation compensation.
- In both models published by the Federal Reserve, the expected path of short-term rates over the next two years explains about a fifth of the rise in the 10-year yield since the end of 2025.
- For federal debt alone to explain the 95-basis-point rise in the 5-year rate five years ahead since February 27, CBO’s projected debt ratio would have to rise by 24 to 48 points; the data we found support at most 2.3.
What happened: the highest close since 2002
The 10-year closed at 5.31 percent on October 5, 2026, and at 5.24 percent on October 9. The low of the year was 3.97 percent on February 27.
How high is that? It depends on the comparison. Against the average from 2010 to 2021, 2.20 percent, the 10-year is about 3 points higher. Against the average from 2000 to 2007, 4.71 percent, it is about half a point higher. Rates look extreme against the zero-rate years and fairly normal against the years before 2008.
The inflation-protected 10-year Treasury (TIPS) paid 2.95 percent above inflation on October 5, 2026, the most since November 2008.
1 · “Yields rose because inflation is back”
Verdict: Doesn’t hold for 2026
The claim at its best. Inflation was high in 2022 and 2023. Consumer prices were still 3.4 percent higher in August 2026 than a year earlier. If investors fear inflation is coming back, they demand higher yields to protect themselves.
The data. We split the 10-year yield into two parts. The real yield is what the inflation-protected Treasury pays above inflation. Inflation compensation is the gap between the ordinary and the inflation-protected yield: roughly what the market charges for expected inflation. Both come from the Treasury’s daily par yield curves, at the close.
From February 27 to October 9, 2026, the 10-year rose 1.27 points. The real yield rose 1.19 points. Inflation compensation rose 0.08 points. On October 9 it stood at 2.33 percent a year, almost exactly its 2003-to-2007 average of 2.34 percent. At the five-year horizon, inflation compensation even fell, by 0.06 points since February 27. Measured for the five years that start five years from now, a horizon the Fed itself watches, it was 2.32 percent, against 2.40 percent in 2003 to 2007.
Verdict: Doesn’t hold as an inflation scare. About 94 percent of the rise was real.
Strongest objection. Inflation can raise yields without any change in inflation compensation: high inflation makes the Fed raise rates, and that lifts real yields. That channel belongs to explanation 2, and we test it there. Inflation compensation is also not a pure forecast. It contains a liquidity effect and an inflation risk premium, but that doesn’t turn a 0.08-point move into an inflation scare.
What would change the verdict. Inflation compensation moving clearly above its 2003-to-2007 range, or a run of high inflation prints that the long end prices in.
2 · “The Fed did it”
Verdict: Half true
The claim at its best. On September 16, 2026, the Fed raised its target range by a quarter point to 3.75 to 4 percent, its first increase since 2023. Markets that expect more increases push up yields at every maturity.
The data without a model. Since the end of 2025, the 2-year yield rose 1.33 points and the 10-year 1.06 points, both to October 9, 2026. The short end moved more. The gap between the 10-year and the 2-year narrowed from 71 basis points (hundredths of a percentage point) at the end of 2025 to 44. That is the pattern you expect when the Fed leads.
The data with two models. Two models published by the Federal Reserve split the 10-year yield into the expected path of short-term rates and a term premium, the extra yield investors demand for locking money up for ten years. The expected path can be split again, into the next two years, which is mostly about the Fed’s next moves, and the years after that.
| Rise since Dec 31, 2025, to Oct 2, 2026, percentage points | Fed Board model (Kim-Wright) | New York Fed model (ACM) |
|---|---|---|
| 10-year yield in the model | +1.01 | +1.01 |
| Expected short rates, next two years | +0.18 | +0.19 |
| Expected short rates, years 2 to 10 | +0.32 | +0.65 |
| Term premium | +0.51 | +0.17 |
In both models, the next two years of expected Fed policy explain about a fifth of the rise. The models disagree on the rest: Kim-Wright puts about half into the term premium, ACM puts about two thirds into expected short rates further out.
Fed Chair Warsh named three reasons for the rise in long rates since the July meeting at his September 16 press conference: growth, competition for capital and geopolitics. He called it “not an exclusive list”.
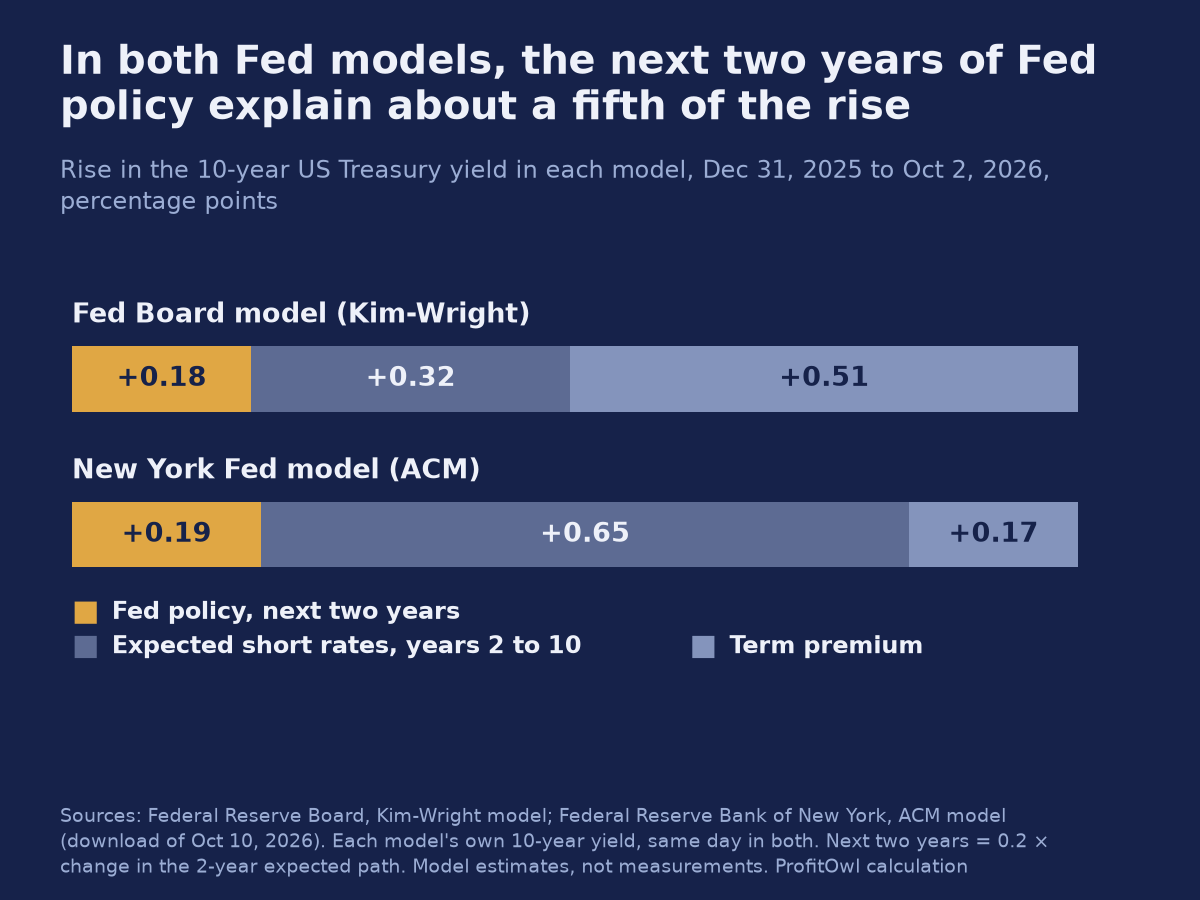
Verdict: Half true. The Fed led the short end, and the curve flattened the way a Fed-driven rise looks. But the next two years of Fed policy carry only about a fifth of the 10-year’s rise in both models. Most of it sits further out.
Strongest objection. Expected rates in years 2 to 10 can also reflect the Fed: a market that thinks the Fed will keep rates high for longer, or no longer trusts it to bring inflation down, moves those years too. The models can’t tell a “higher for longer” Fed from a higher neutral rate.
What would change the verdict. The October 27–28, 2026 Fed meeting. If the Fed signals a pause and long yields keep rising, the Fed story gets weaker.
3 · “Rates are high because Washington borrows too much”
Verdict: Doesn’t hold for the 2026 jump
Verdict: Can’t be settled for the level
The claim at its best. The US runs large deficits in good times. More debt means more bonds for investors to absorb, so they demand a higher yield.
Debt can’t explain the 2026 jump. The Congressional Budget Office’s February 2026 projections show deficits between 5.6 and 6.7 percent of GDP in every year through 2036, and debt held by the public rising from 100.6 percent of GDP in fiscal 2026 to 120.2 percent in 2036. But that path didn’t get heavier in 2026. CBO had not published a new debt projection since February as of October 5, 2026. The deficit from October 2025 to August 2026 was $1.966 trillion, slightly smaller than the $1.973 trillion a year earlier.
To size the debt channel, we use the research. US studies find that one extra percentage point of projected debt-to-GDP raises forward rates five years ahead by about 2 to 4 basis points. These come from CBO (2024), Plante, Richter and Zubairy, and Bhatt and co-authors (2026). CBO’s own paper also shows the other side: without controls for Fed and foreign holdings, its estimate turns negative, at minus 4.5 basis points.
We measure the 5-year rate five years ahead: the rate the bond market implies for a five-year loan that starts five years from now. Researchers use it because it depends far less on what the Fed does next. From February 27 to October 2, 2026, it rose 95 basis points. For debt alone to explain that, CBO’s projected debt ratio would have to rise by 24 to 48 points. That equals an extra deficit of 5.1 to 10.3 percent of GDP every year from fiscal 2027. The data we could find support at most 2.3 points of debt ratio, from the upper range of the primary dealers’ deficit estimates and the administration’s own budget numbers. That is worth 0.05 to 0.09 points on rates. Even a stress test with tariff revenue back at 2025 levels adds only 5.1 points of debt ratio, worth 0.10 to 0.20 points on rates.
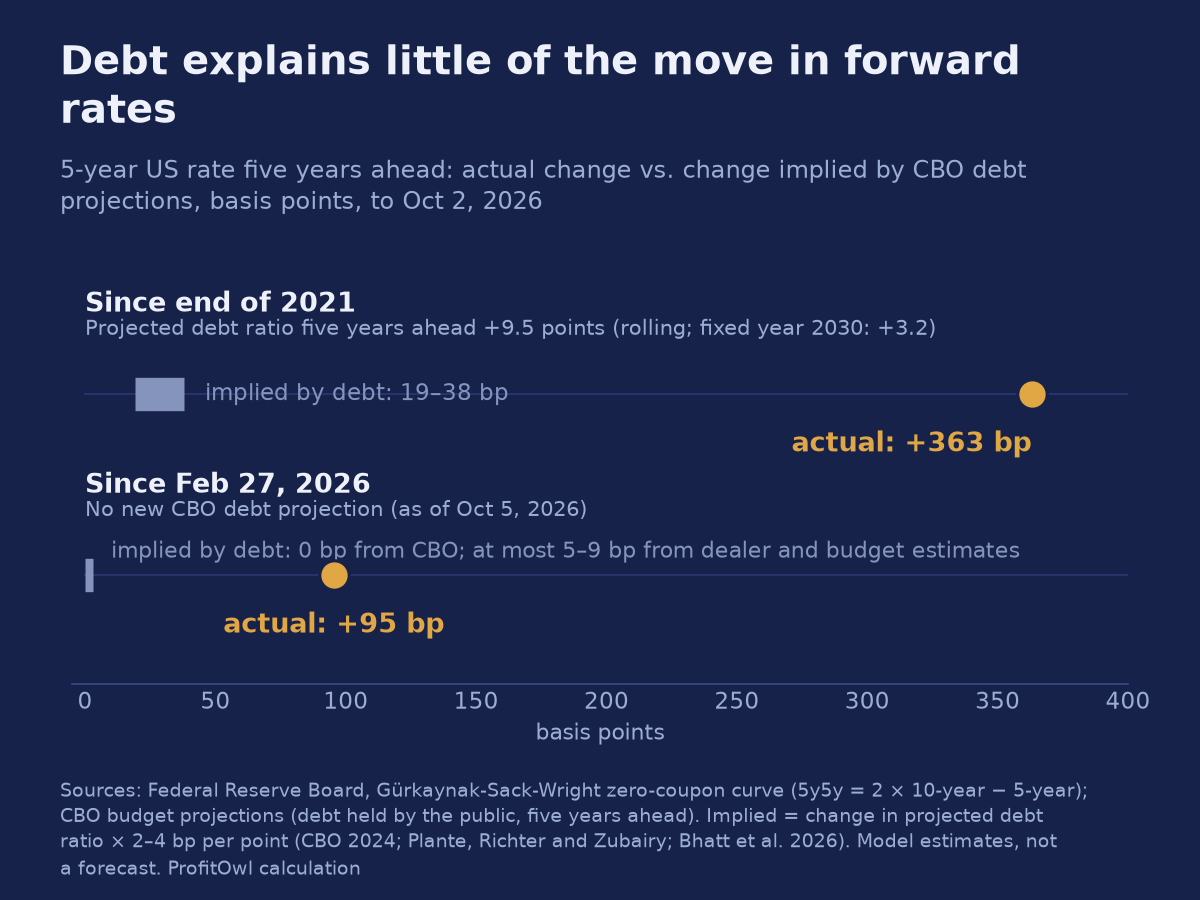
The level is a different question. Against the 2010-to-2021 average, the 5-year rate five years ahead is 2.49 points higher today. The same research estimates, applied to CBO’s numbers, would put 0.46 to 1.21 points of that gap on debt. Against the 2000-to-2007 average, the picture flips. The estimates would predict a rate 1.63 to 3.26 points higher than then, yet it is 0.04 points lower. Estimates like these can’t settle a comparison across decades.
What about bond supply? Treasury has kept the auction sizes of its regular notes and bonds unchanged since April 2024, apart from inflation-protected ones. The most it buys back of older long bonds per operation rose from $2 billion to $6 billion from September 10, 2026. The Treasury Borrowing Advisory Committee expects larger coupon auctions from fiscal 2027. More supply is coming, but it hadn’t arrived by October 2026.
And interest costs? CBO’s projections five years ahead grew through interest, not through the rest of the budget. Between the July 2021 edition (for fiscal 2026) and the February 2026 edition (for fiscal 2031), projected interest costs rose by 2.33 percent of GDP, while the primary deficit, before interest, fell by 0.18 points. One caveat: CBO’s 2026 baseline counts on tariff revenue of 1.04 percent of GDP. Without it, the primary deficit would look about half a point worse.
Verdict: Doesn’t hold for the 2026 jump. Can’t be settled for the level.
Strongest objection. The research measures average effects. Markets can reprice debt suddenly, without a new projection, when attention shifts. Britain in 2022 is the example (below). The Bank for International Settlements also points to fiscal pressures behind the premium part of the rise (explanation 4).
What would change the verdict. A new CBO projection with a much heavier debt path, or weak Treasury auctions that move yields on the day.
4 · “Investors demand a bigger premium”
Verdict: Half true
The claim at its best. Investors want extra pay for locking up money for ten years when the future is uncertain. If uncertainty about debt, inflation or policy rises, so does that term premium.
The data. The term premium can’t be observed. It can only be estimated. In both models published by the Federal Reserve, it rose in 2026. From the end of 2025 to October 2, it went from 0.571 to 1.085 percent in the Fed Board’s Kim-Wright model and from 0.748 to 0.914 percent in the New York Fed’s ACM model. That is 51 percent of the 10-year’s rise in Kim-Wright and 16 percent in ACM, measured on the same day. Since February 27, the shares are 51.5 and 26.3 percent.
Both premiums reached their highest in more than ten years in autumn 2026: Kim-Wright 1.085 percent on October 2, the highest since April 2010, and ACM 0.985 percent on October 7, the highest since June 2014. Against their 2000-to-2007 averages, Kim-Wright is now 8 basis points above, ACM 44 basis points below.
Why do they differ? They are different models, estimated by different research teams; neither is an official Federal Reserve statistic. The gap between them is a result, not an error.
The Bank for International Settlements estimated in September 2026 that about 40 percent of the rise in the 10-year since late June 2026 was term premium. It said the premiums “reflected fiscal pressures rather than inflation concerns”, and that the causes are difficult to disentangle. The International Monetary Fund found that large moves in the 10-year yield on Treasury auction days have become bigger: one auction day in ten has seen a move of at least 11 basis points since 2023, against 6 in 2020 to 2022.
Verdict: Half true. Both models agree the premium went up. They disagree on whether it is a sixth or half of the rise.
Strongest objection. Averaging the two models would give one number. We don’t, because they make different assumptions, and averaging hides the disagreement.
What would change the verdict. Both models moving together for several months, or a third, independent estimate.
5 · “It’s global”
Verdict: Holds
The claim at its best. US yields rose because yields rose everywhere. Something common moved all large bond markets.
The data. From the end of 2025 to September 30, 2026, 10-year yields rose 1.11 points in the US, 0.99 in Japan, 0.91 in the UK, 0.86 in Portugal, 0.82 in Spain and 0.70 in Germany. Week by week, 72 percent of the ups and downs in US, German, British and Japanese 10-year yields in 2026 were one shared movement, up from 68 percent in 2025.
Did the US rise more than the rest of the world explains? We fitted the weekly moves of the US 10-year from 2023 to 2025 on German, British and Japanese 10-year yields alone. Applied to 2026, that model predicts a US rise of 1.03 points to September 30; the actual rise was 1.11. Add the US 2-year yield to the model, and nothing US-specific is left at the long end.
Japan’s 10-year rose above 3 percent on September 2, 2026, for the first time since 1996. Its 30-year reached a record 4.17 percent on October 6 on the finance ministry’s curve, which starts in 1999.
Did debt decide who rose most? Roughly, more debt went with a somewhat bigger rise. But Japan, with gross government debt of about twice its economy, rose less than the US, and Germany, at 63 percent, still rose 0.70 points. Debt may help explain why some countries rose more than others. It doesn’t explain why all of them rose. Six countries are an illustration, not a statistical test.
France shows what a country-specific debt premium looks like. In August 2026, France paid 0.82 points more than Germany on 10-year bonds, more than Italy (0.80) and Greece (0.69), in the European Central Bank’s monthly data. The gap widened further in late September and early October 2026, in daily benchmark yields published by the Banque de France; we don’t reproduce those values here. Nothing like that shows up for the US.
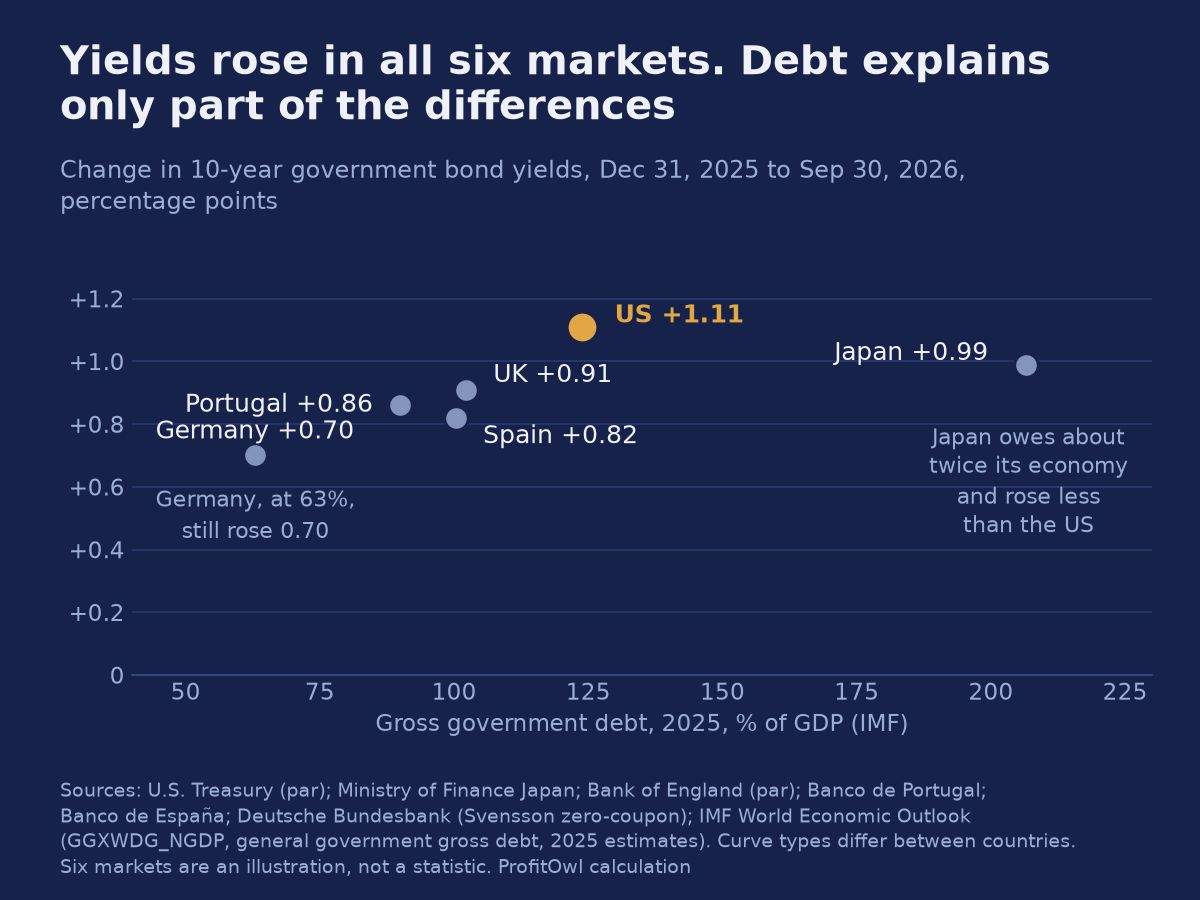
Verdict: Holds. The US rise in 2026 followed the common global move, plus its own short end.
Strongest objection. “Global” can be a symptom, not a cause: the US is the largest bond market and may export its own rise. A shared movement tells you that markets moved together, not who moved first.
What would change the verdict. US yields rising while other large markets fall, or a growing US-only gap at the long end.
6 · “AI is soaking up capital and pushing up rates”
Verdict: Can’t be settled yet
The claim at its best. The largest technology companies are spending hundreds of billions on data centers. That demand for capital competes with governments for savings and pushes up real interest rates. The Economist argued this on October 8, 2026.
The data. The five largest cloud companies (Alphabet, Amazon, Meta, Microsoft and Oracle) spent $566 billion on property and equipment in the four quarters to mid-2026, 3.6 times as much as in 2022. In the second quarter of 2026 alone they spent $181.5 billion. At an annual rate that is 2.23 percent of US GDP, up from 0.62 percent at the end of 2022. This is worldwide spending compared with the size of the US economy, not a share of it.
The national accounts confirm the boom. US business investment in information processing equipment and software reached 5.05 percent of GDP in the second quarter of 2026, the highest since records began in 1947.
The timing is mixed. From the end of 2022 to the end of 2025, cloud spending rose by about 1 percent of GDP, while the real 10-year yield rose only 0.34 points on a quarterly average. Then, in the first half of 2026, spending accelerated again, by another 0.57 percent of GDP in two quarters.
Two Fed models estimate the natural rate of interest, the real rate that neither speeds up nor slows down the economy (economists call it r*). That is where a lasting capital-demand effect should show. From the end of 2025 to mid-2026, the New York Fed’s model (Holston, Laubach and Williams) rose 0.12 points to 1.01 percent, and the Richmond Fed’s model (Lubik and Matthes) rose 0.15 points to 1.85 percent. Over the same two quarters, the real 10-year yield rose 0.22 points on a quarterly average. Most of the real-yield jump came later, in July to September 2026, when it averaged 2.46 percent. The models don’t cover that quarter yet. The Richmond estimate comes with a wide band, from 1.14 to 2.65 percent. Market prices point the same way: expected short rates five to ten years ahead rose 0.23 points in Kim-Wright and 0.66 points in ACM from the end of 2025 to October 2.
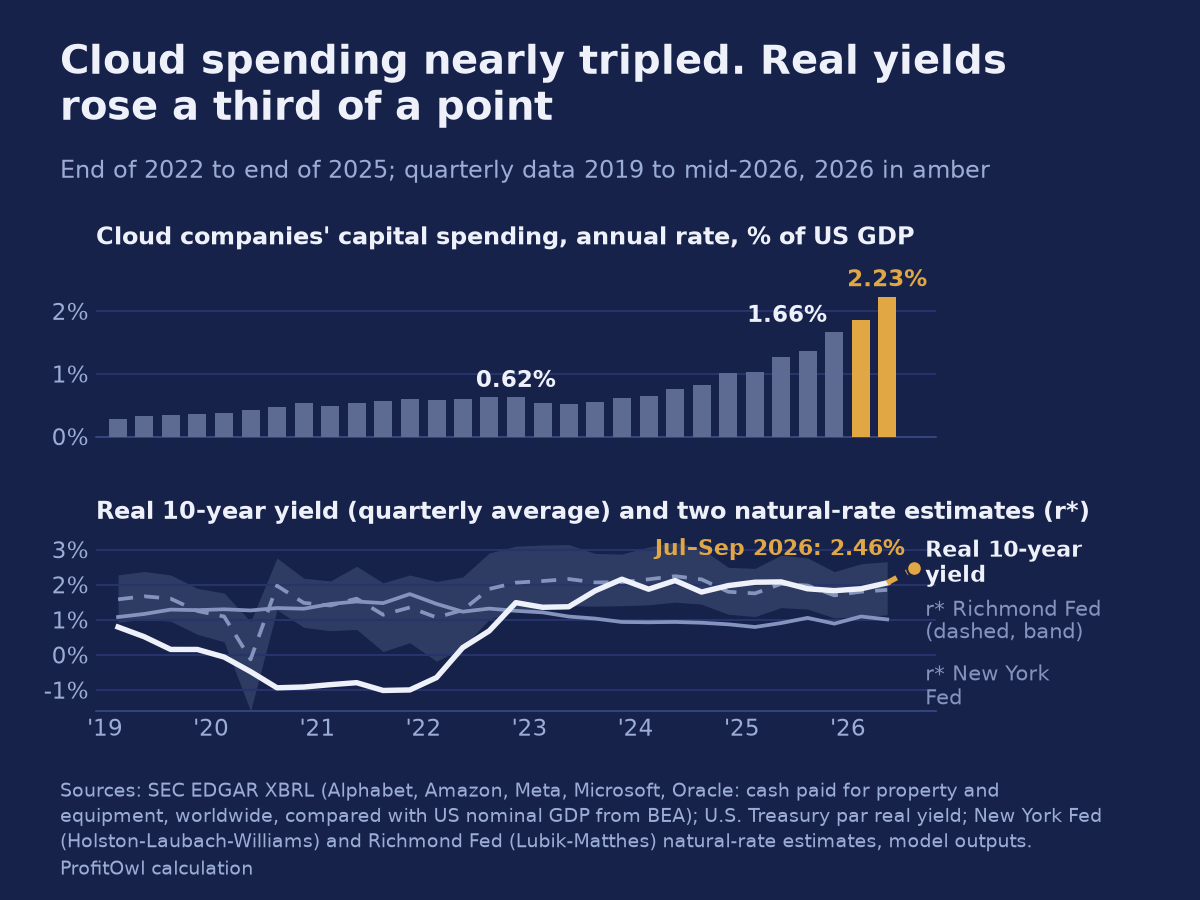
Verdict: Can’t be settled. The boom is real and record-sized. It didn’t move real yields much from 2023 to 2025. Its 2026 acceleration coincides with the jump, and longer-run rate expectations rose, but the natural-rate models don’t yet cover the quarter that matters. A plausible contributor, not shown to be the driver.
Strongest objection. Natural-rate models are slow by design and may catch up. Markets price expected investment before it shows up in the accounts.
What would change the verdict. Natural-rate estimates rising in both models for several quarters. Real yields falling when cloud spending slows. Evidence on how the spending is financed, for example a surge in bond issuance by these companies (not measured here).
For comparison: what a fiscal shock looks like
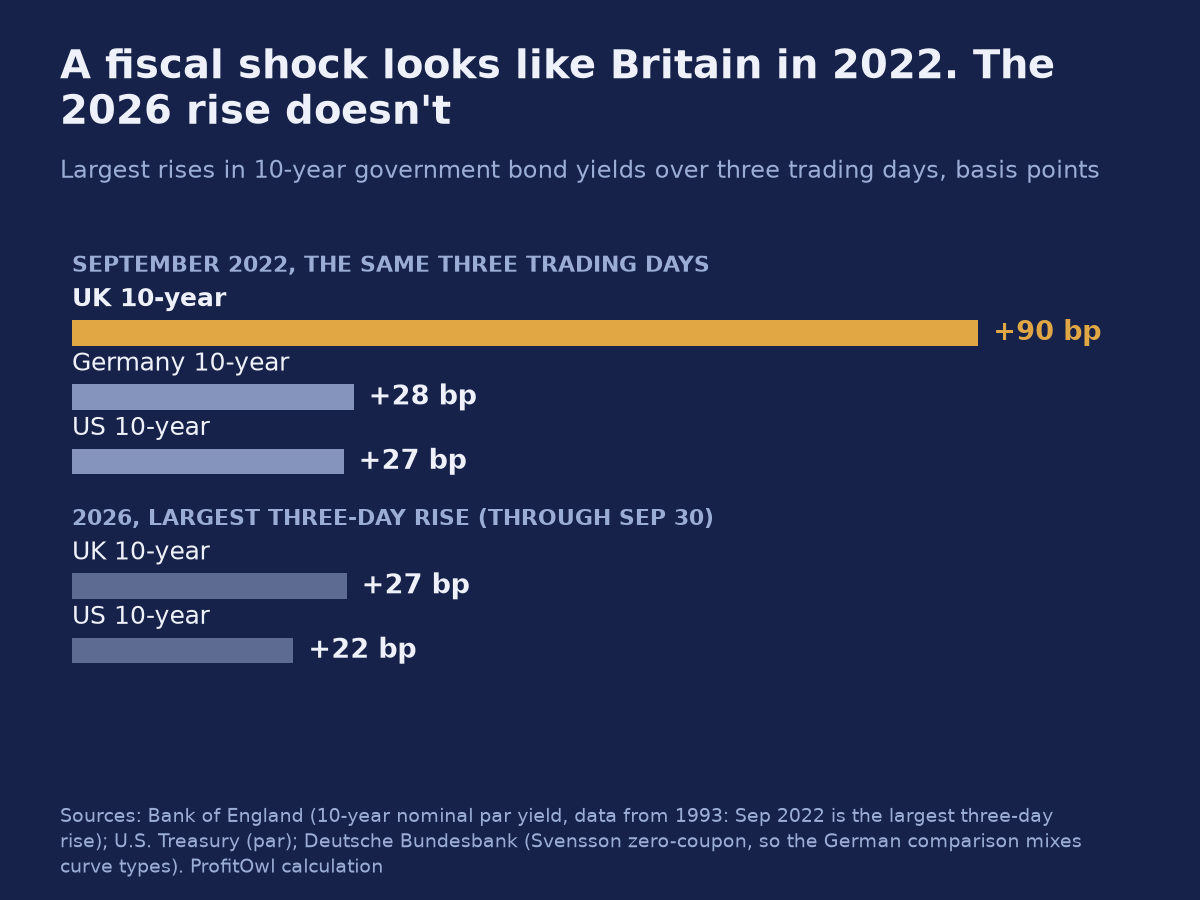
In September 2022, the British government announced large unfunded tax cuts. The yield on 10-year gilts, British government bonds, rose 0.90 points in three trading days, from September 22 to 27. That was the largest three-day rise in Bank of England data going back to 1993. Over the same three days, US and German 10-year yields rose about 0.27 and 0.28 points. Leveraged pension funds made it worse, and the Bank of England stepped in.
In 2026, through September, the largest three-day rise was 0.27 points in Britain and 0.22 points in the US. A sudden shock like Britain’s is absent. A slow fiscal premium, like France’s, can’t be ruled out for the US: auction days move the 10-year more than they used to (explanation 4).
What we think
This is the only part of the note that is opinion.
So who did it? The debt is at the scene. It is a reasonable candidate for why rates are higher than in the 2010s, and the interest bill makes the problem compound. But the jump since February doesn’t carry its fingerprints: no new projection, no US-only gap at the long end, no sudden shock. The jump looks like a real-rate repricing that markets shared around the world, led at the short end by the Fed, with a premium and longer-run expectations we can’t size precisely. The AI boom is the most interesting open question.
What to watch: the Fed meeting on October 27–28, 2026, the next CBO projection, and the next natural-rate updates from the New York and Richmond Fed. If long yields keep rising while the Fed pauses, or a new CBO path is much heavier, the debt story gets stronger. We will update this note when they come.
None of this is investment advice. It is a dated reading of public data.
Data and methods in detail
Yields. US Treasury Daily Par Yield Curve Rates, nominal and real (TIPS), closing values, constant maturity. Inflation compensation = nominal minus real par yield. We never use intraday or press benchmark yields.
Term premium and expected path. Federal Reserve Board, Kim-Wright model; Federal Reserve Bank of New York, ACM model; 2-, 5- and 10-year yields and term premia. Expected path = model yield minus term premium. The next two years contribute 0.2 times the change in the 2-year expected path to the 10-year one. Shares of a rise use each model’s own yield, on the same day in both models, from one download each, because ACM is re-estimated over its whole history with each update.
Forward rates. Federal Reserve Board, Gürkaynak-Sack-Wright zero-coupon curves, nominal and TIPS. 5-year rate five years ahead = 2 × 10-year − 5-year zero-coupon yield.
Fiscal channel. CBO budget and economic projections (February 2026 and earlier editions), Monthly Treasury Statement, primary dealer survey and Treasury Borrowing Advisory Committee materials. Effect sizes from CBO Working Paper 2024-05, Plante, Richter and Zubairy, and Bhatt and co-authors (FEDS 2026-031). The studies estimate forward rates five years ahead, mostly the 10-year rate; Bhatt and co-authors measure a real rate, which we use only as an upper bound.
International. European Central Bank long-term interest rates for convergence purposes (monthly); Bundesbank (Svensson zero-coupon), Bank of England (par), Ministry of Finance Japan, Banco de Portugal and Banco de España (benchmark) 10-year yields; curve types differ between countries. IMF World Economic Outlook gross government debt (2025 estimates). The shared movement is the first principal component of weekly changes. The model without the US is an ordinary least squares fit of weekly changes, 2023 to 2025, applied to 2026.
AI investment. SEC EDGAR XBRL company facts for the five companies: cash paid for property and equipment, quarterly values derived from year-to-date cash flow statements and checked against each annual report (51 fiscal years). BEA private fixed investment via FRED (information processing equipment and software, computers, software, total nonresidential). US nominal GDP from BEA.
Natural rate. Federal Reserve Bank of New York, Holston-Laubach-Williams current estimates; Federal Reserve Bank of Richmond, Lubik-Matthes estimates with uncertainty band. Both are model estimates, not measurements.
Checks. Every number in this note is tied to a line in our source register and checked against the underlying table by a script before publication. The register and the scripts are not published with this note.
Don’t quote us on
- “AI caused the rise in yields.” We haven’t shown that.
- “The term premium explains most of the rise.” One model says about half, the other about a sixth.
- “The 10-year hit 5.34 percent.” That is an intraday press figure; we use closing values.
- “CBO raised its debt forecast.” It didn’t publish a new one between February and October 5, 2026.
- “The US carries a fiscal premium of so many basis points.” Our model without the US finds no US-specific remainder at the long end.
- “Japan is selling Treasuries, so yields rise.” We didn’t test this, and the evidence on the channel is disputed.
- A date for a crisis. We don’t make one.
Changelog
- 1.0 (October 2026): first version, data as of October 9, 2026.
Related
- Project page: Rates, Debt and Inflation: Testing What Everyone Says
- Britain’s 2022 gilt crisis in detail: UK gilt crisis
- What it means for your mortgage, savings and bonds: Why Are Interest Rates So High in 2026?
How to cite this
Misura, Philipp (2026). "Why US Bond Yields Rose in 2026: Six Explanations Tested." Research note, Rates, Debt and Inflation: Testing What Everyone Says, ProfitOwl Research, version 1.0, data as of October 9, 2026. https://profit-owl.com/research/rates-debt-inflation-claims/why-us-yields-rose-2026
Text and charts: CC BY 4.0 (opens in new tab). The underlying data belong to their publishers and remain under their terms; this licence does not cover them.
Primary sources
- 01Daily Treasury Par Yield Curve Rates and Par Real Yield Curve Rates — U.S. Department of the Treasury
- 02Treasury term premia (ACM) — Federal Reserve Bank of New York
- 03Yield curve models and data (Kim-Wright, Gürkaynak-Sack-Wright) — Board of Governors of the Federal Reserve System
- 04Budget and economic data (10-year budget projections) — Congressional Budget Office
- 05Monthly Treasury Statement — U.S. Department of the Treasury, Bureau of the Fiscal Service
- 06FOMC statement, September 16, 2026 — Board of Governors of the Federal Reserve System
- 07Transcript of Chair Warsh's press conference, September 16, 2026 — Board of Governors of the Federal Reserve System
- 08BIS Quarterly Review, September 2026 — Bank for International Settlements
- 09Global Financial Stability Report, April 2026, chapter 1 — International Monetary Fund
- 10The Effect of Government Debt on Interest Rates (Working Paper 2024-05) — Congressional Budget Office
- 11Bhatt et al., FEDS 2026-031 — Board of Governors of the Federal Reserve System
- 12World Economic Outlook database (general government gross debt) — International Monetary Fund
- 13Long-term interest rates for convergence purposes (IRS) — European Central Bank
- 14Government bond yields, 10-year (statistics) — Banco de Portugal
- 15Secondary market for government debt, daily (table ti_1_3) — Banco de España
- 16JGB interest rates (constant maturity) — Ministry of Finance Japan
- 17Statistical Interactive Database (gilt par yields) — Bank of England
- 18Time series databases (yields on federal securities) — Deutsche Bundesbank
- 19EDGAR XBRL company facts — U.S. Securities and Exchange Commission
- 20Private fixed investment in information processing equipment and software (BEA, via FRED) — Federal Reserve Bank of St. Louis / Bureau of Economic Analysis
- 21Measuring the natural rate of interest (Holston-Laubach-Williams) — Federal Reserve Bank of New York
- 22Natural rate of interest (Lubik-Matthes) — Federal Reserve Bank of Richmond
Written by Philipp Misura, who is not a researcher by profession — see about. Corrections go on this page, marked and dated, rather than being made quietly.