The Three-Check Routine Professionals Run Before Every Trade
In 2024 the S&P 500 returned 25%. The average investor captured 16.5%. The gap is not knowledge — it is the absence of a written system professionals use.
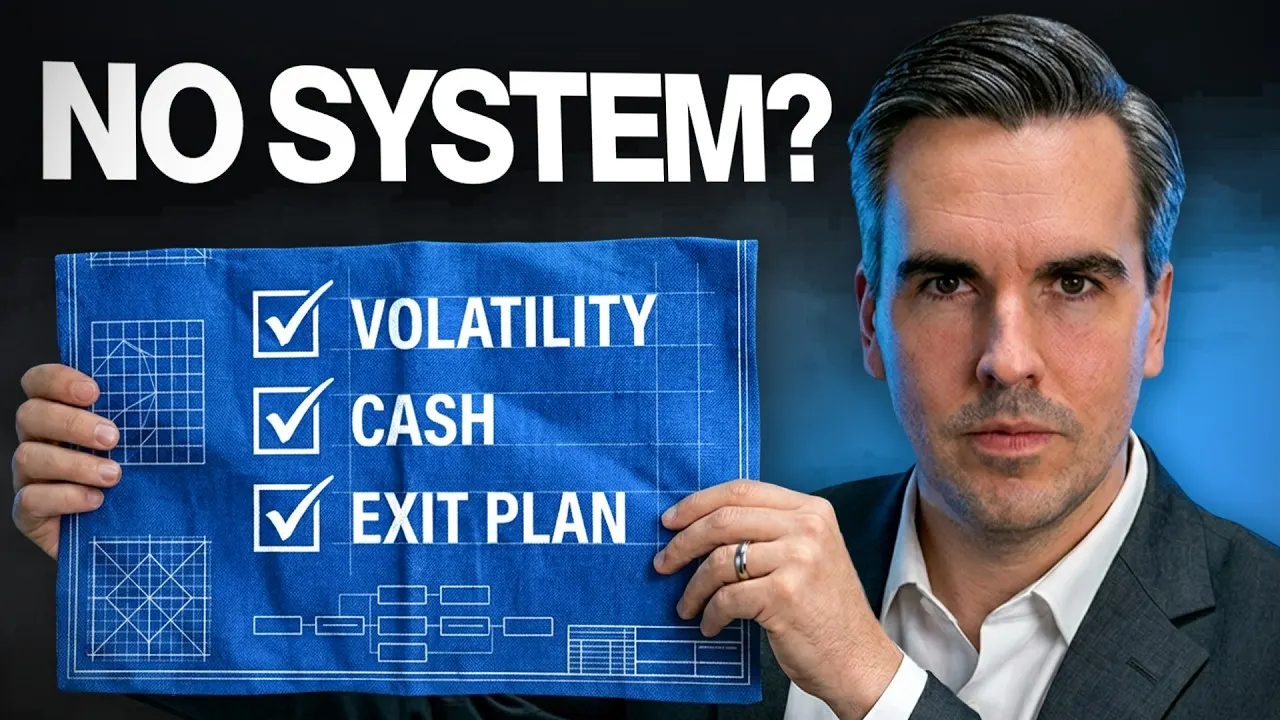
No System? The Boring 3-Check Routine Professionals Run Before Every Trade
Prefer to watch? This article is the written companion to the video above.
In 2024, the S&P 500 returned about 25%. The average equity investor captured only 16.5%.
That is not a rounding error. According to DALBAR’s long-running study of investor behaviour, the average equity investor earned 16.54% against the index’s 25.05% — a gap of 848 basis points, the second-largest of the past decade. And it happened in an up year, when almost anyone could have made money.
The cause was not a lack of information. Every number the pros had was freely available to everyone. The cause was behaviour: investors pulled money out of equity funds in every quarter of 2024 and bought back just before the biggest surges.
On a trading floor, intelligence is surprisingly cheap. Discipline is what actually costs money. After two decades in banking, I can tell you the difference between retail and institutional results is rarely IQ. It is a system — a physical, written system that removes the one decision emotion always ruins: when to act.
Here is that system. It is boring. That is the point.
Professionals don’t trade opinions. They trade rules.
Retail investors are addicted to the home run — the story of doubling their money in a stock. Institutions are built around a different instinct: not losing. Their entire mandate rests on risk management first.
The clearest example is cash. By the third quarter of 2025, Berkshire Hathaway held a record $381.7 billion in cash and Treasury bills — a figure that climbed to $397.4 billion by early 2026. Warren Buffett was not hiding under the bed. His rules simply did not see enough worth buying at the prices on offer.
Institutions do not treat cash as a safety net. They treat it as strategic ammunition — deployed only when the maths screams buy.
Everything below is how you turn that instinct into a routine you can actually run.
The pre-commitment
Before we build it, one honest question: what exact number triggers your decision to sell?
Not a feeling. A number. If you cannot answer, you are flying blind — and the rest of this article is about fixing exactly that. This is the same problem the Value at Risk formula solves for institutions: it replaces judgement-under-stress with a rule defined in advance.
Check 1 — Volatility status
The VIX measures the price of fear in US markets. It matters to you for one reason: institutions run on risk budgets, and when volatility spikes, risk becomes expensive. Their own models then force them to sell — not because Apple got worse, but because their risk budget blew out.
So a spiking fear gauge tells you the selling around you may be mechanical, not informed. A simple, workable rule: track the VIX against its own recent average (say its 10-day moving average). When it spikes above that, halt new long entries. That usually signals institutional stress and forced selling — and you do not want to be buying into a stampede of forced sellers.
For European equities, use the V2TX — the EURO STOXX 50 Volatility Index — as your regional fear gauge.
(Why forced selling happens mechanically, and how it once crashed the whole market, is its own story.)
Check 2 — The strategic cash reserve
This is where most private investors fail completely.
Many regulated funds actively manage liquidity and define target cash buffers in their mandates — often in the mid-single digits. For you, that reserve is strategic ammunition: it stops you from being a forced seller at the bottom.
The non-negotiable discipline is separation. Your emergency fund and your tactical cash are two different buckets:
Do not mix your broken-car bucket with your broken-market bucket.
(The full three-bucket architecture — emergency fund, liquidity layer, growth engine — is here.)
And yes, cash costs you something. Reframe it as an insurance premium. You pay car insurance every year hoping never to crash, and you do not call it wasted. The premium even varies by currency: in 2025, short-term US Treasury bills yielded enough to beat US inflation — your ammunition paid you to hold it. In the euro area, high-quality government bills often left you roughly flat to slightly negative in real terms. Cheaper insurance in dollars, more expensive in euros — but insurance either way.
Check 3 — The operationalised exit plan
Every position needs kill criteria — defined before you buy, while you are calm.
Workable, hard triggers used on institutional desks:
- Thesis breach — the company cuts its own profit forecast by more than about 5%. When management says “we will earn less than we promised,” that is a signal, not a dip to buy.
- Trend break — the price breaks a long-term trend (e.g. the 200-day moving average) on heavy volume.
- Cash-flow collapse — free cash flow falls for two consecutive quarters.
The exact triggers matter less than the principle. If you have not written your exit before you enter, you are trading on hope. (The fuller framework for exit decisions is here — and why a naive stop-loss is a target, not a shield.)
Build it today — three steps
- Separate your buckets. Emergency fund ≠ tactical cash. Never mix them.
- Choose a simple liquidity instrument. For most people a high-quality money-market fund or short-dated government bills is plenty. You do not need anything exotic.
- Write your Investment Policy Statement. One page: your volatility threshold, your cash target, your hard exit metrics. Not in your head — on paper.
The whole idea
You cannot control the market. You can control your mandate.
The professional who calmly buys at the bottom is rarely smarter than the amateur who panicked. He simply operated under rules that forbade emotion — rules written down long before the stress arrived. The three checks exist to move every decision out of the fearful present and into a calm, pre-committed plan.
The market rewards patience — but only if patience has a plan. Build your mandate. Follow the math.
Educational content only — not investment advice, and not a personal recommendation. Thresholds, yields and the exit triggers above are illustrative and change over time. Speak to a qualified, licensed professional before acting.
Primary sources
- 01DALBAR 2025 QAIB — average equity investor earned 16.54% in 2024 vs 25.05% for the S&P 500, an 848-basis-point gap — DALBAR, Inc. (Quantitative Analysis of Investor Behavior)
- 02Berkshire Hathaway cash and Treasury bills reached a record $381.7bn in Q3 2025, rising to $397.4bn in Q1 2026 — Berkshire Hathaway / SEC filings
- 03Cboe Volatility Index (VIX) — the market's measure of expected volatility, i.e. the 'price of fear' — Cboe Global Markets
Questions people actually ask
Why does the average investor underperform the market so badly?
Because of behaviour, not knowledge. In 2024 the S&P 500 returned 25.05%, but DALBAR's data shows the average equity investor earned only 16.54% — a gap of 848 basis points, the second-largest of the decade. The cause was withdrawing from equity funds in every quarter and buying back just before the biggest surges. The information was freely available to everyone; what most investors lacked was a system that removed the emotional timing decision. Intelligence is cheap on a trading floor. Discipline is what actually costs money.
What is an Investment Policy Statement?
A short written document that says, in advance, what you will do when specific things happen — 'if X, then Y' — so that no decision is made in the heat of the moment. Institutions never open an annual meeting by resolving to 'invest better'; they point to a policy statement that already defines their volatility thresholds, cash targets and exit rules. The whole value is that it is written down before the stress arrives. A rule you hold only in your head is not a rule; it is a hope that bends the moment you are afraid.
What are the three checks?
A pre-trade routine that takes minutes. Check one is volatility: is the fear gauge (the VIX, or the V2TX for European equities) spiking above its recent average, which signals institutional stress and forced selling? Check two is your strategic cash reserve: is your tactical 'ammunition' intact, and separate from your emergency fund? Check three is your exit plan: does this specific position already have predefined kill criteria written down before you buy? If any check fails, you wait. The routine is deliberately boring — boring is what survives a downturn.
What is the VIX and why check it before buying?
The VIX is the market's measure of expected volatility — effectively the price of fear in US equities. It matters because institutions run on risk budgets: when volatility spikes, risk becomes 'expensive' and their own models force them to sell, regardless of whether the underlying companies are any worse. A spiking VIX therefore tells you that the selling around you may be mechanical rather than informed — forced sellers dumping into the market. That is not a moment to stand in front of; it is a moment to check whether the forced selling has finished. For European equities the equivalent gauge is the V2TX, the EURO STOXX 50 Volatility Index.
How much cash should I hold as a strategic reserve?
Enough to act when others cannot, held separately from your emergency fund. Many regulated funds define target cash buffers in their mandates, often in the mid-single-digit percentages, precisely so they are never forced to sell good assets at the bottom. The key discipline is separation: your emergency fund (the broken-car money) and your tactical reserve (the broken-market money) are two different buckets and must never be mixed. This reserve is not idle timidity — it is strategic ammunition you deploy only when your rules say buy.
Isn't holding cash just a drag on returns?
It is a cost — but the right way to see it is as an insurance premium. You pay for car insurance every year hoping never to crash, and you do not call the premium wasted. A strategic cash reserve works the same way: it usually costs you a little in return, and occasionally lets you buy heavily at the bottom of a drawdown, which changes the maths over a full market cycle. The cost also varies by region: in 2025, short-term US Treasury bills yielded enough to beat US inflation, giving a small positive real yield, while high-quality euro-area government bills often left euro investors roughly flat to slightly negative in real terms. Cheaper insurance in dollars; more expensive in euros — but insurance either way.
What are 'kill criteria' and why set them before buying?
Kill criteria are the predefined, hard conditions under which you will sell a position — written down before you own it, when you are calm and objective. Workable examples used on institutional desks include: the company cuts its own profit forecast by more than about 5% (management telling you it will earn less than promised), the price breaks a long-term trend such as the 200-day moving average on heavy volume, or free cash flow collapses for two consecutive quarters. The specific triggers matter less than the principle: if you have not defined your exit before you enter, you will end up trading on hope, which is not a plan.
What does Berkshire's cash pile teach retail investors?
That cash can be a deliberate strategic position, not a failure to invest. Berkshire Hathaway's cash and Treasury bills climbed to a record $381.7bn by the third quarter of 2025 and $397.4bn by the first quarter of 2026. Warren Buffett did not hold that out of fear; he held it because his rules did not see enough to buy at prices he liked. The lesson is not to copy the number — it is to treat cash as ammunition governed by rules, deployed when the maths says so, rather than as money that is 'lazy' and must always be put to work immediately.
How do I actually build this system?
Three steps. First, separate your capital into distinct buckets, and never mix your emergency fund with your tactical investing cash. Second, choose a simple, liquid instrument for the reserve — for most people a high-quality money-market fund or short-dated government bills is plenty; exotic products are unnecessary. Third, write your Investment Policy Statement today: your volatility threshold, your cash target, and your hard exit metrics, on a single page. The point is not sophistication. It is that the decisions exist on paper before the market ever tests them.
What is the single idea behind the whole routine?
That you cannot control the market, but you can control your mandate. Every part of the routine — the volatility check, the cash reserve, the written exit rules — exists to move decisions out of the emotional present and into a calm, pre-committed plan. The professional who buys at the bottom is rarely smarter than the amateur who panicked; he simply operated under rules that forbade emotion. The market rewards patience, but only if patience has a plan.